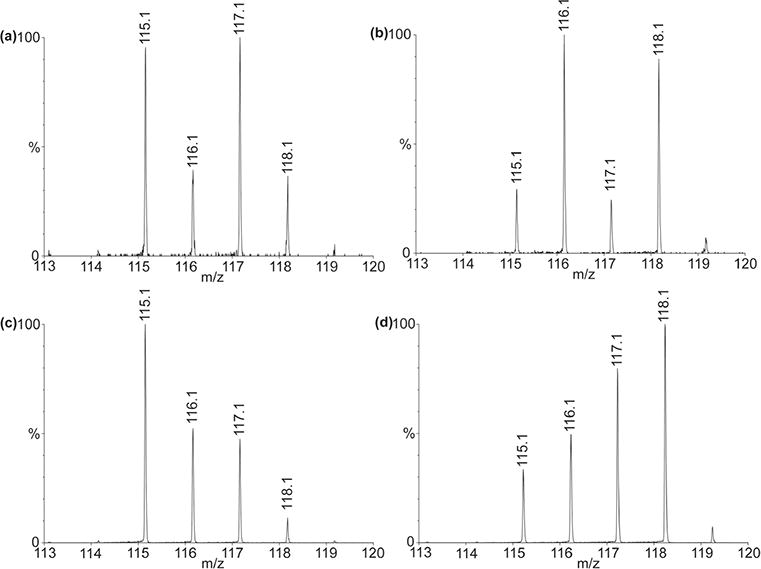
Figure 5.

Quantitation of reporter ions for peptide (a, b) GDRNFLRFamide (m/z 1023.55) and (c, d) APSGFLGM(O)Ramide (m/z 950.49). Signature ions represent neuropeptide abundances in brains. In panels (a) and (c): m/z 115 for 1 adult brain; m/z 116 for 4 juvenile 7th brains; m/z 117 for 90 larvae 2nd brains; m/z 118 for 90 embryonic brains. Panels (b) and (d) are reversed labeling of panels (a) and (c), respectively. In panels (b) and (d): m/z 115 for 45 embryonic brains; m/z 116 for 45 larvae second brains; m/z 117 for 2 juvenile seventh brains; m/z 118 for 0.5 adult brain.
