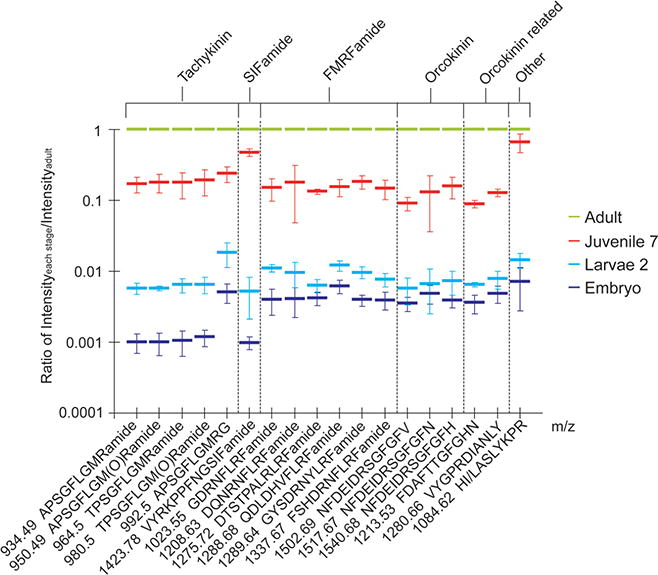
Figure 6.

Neuropeptide quantitation using DiLeu labeling. The X-axis represents different neuropeptides (bottom bar) belonging to six families (top bar) listed by masses. The Y-axis illustrates the ratio of peptide amount of each stage divided by peptide amount of adult stage.
