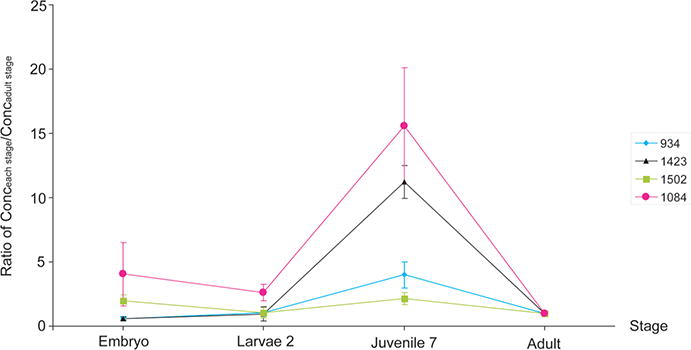
Figure 7.

Trends of neuropeptide concentration changes of four individual peptides from different families. The X-axis illustrates multiple developmental stages. The Y-axis illustrates the ratio of peptide concentration of each stage divided by peptide concentration of adult stage. It is evident that, in juvenile seventh stage, neuropeptide concentrations are the highest.
