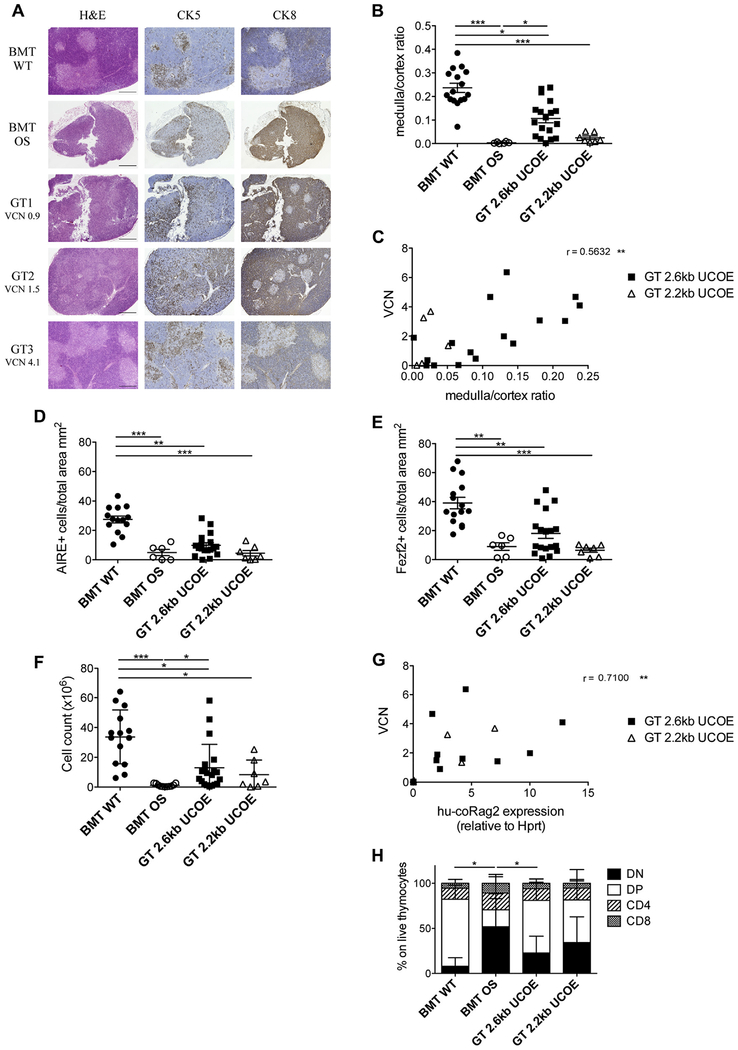
FIG 3.
Thymic characterization. A, Histologic analysis of thymic sections stained with hematoxylin and eosin (H&E), cytokeratin (CK) 5, and cytokeratin 8 of representative BMT WT, BMT OS, and GT 2.6kbUCOE mice. VCN in the thymus is indicated for GT mice. Scale bar = 500 μm. B, Ratio between the thymic medullary and cortical areas. C, Correlation between the medulla/cortex ratio and VCN of GT 2.6kbUCOE (squares) and GT 2.2kbUCOE (triangles) mice. The Spearman r value is indicated. D, Counts of AIRE+ cells in analyzed thymic sections (in square millimeters). E, Counts of Fexf2+ cells in analyzed thymic sections (in square millimeters). F, Thymic cellularity (cell counts). G, Correlation between VCN and vector-induced human codon-optimized Rag2 (hu-coRag2) expression in thymocytes of GT 2.6kbUCOE (squares) and GT 2.2kbUCOE (triangles). Spearman r values and statistical significance are indicated. H, Distribution of double-negative (DN), double-positive (DP), and single-positive CD4 and CD8 cells in thymi (means ± SDs). BMT WT mice, n = 16; BMT OS mice, n 5 10; GT 2.6kbUCOE mice, n = 20; GT 2.2kbUCOE mice, n = 6. Statistical significance was determined by using the nonparametric 1-way ANOVA with the Dunn posttest (Fig 3, B and D–F) by using Spearman correlation (Fig 3, C and G) or the nonparametric combination test (Fig 3, H). *P < .05, **P < .01, and ***P < .001. Error bars represent SDs.

