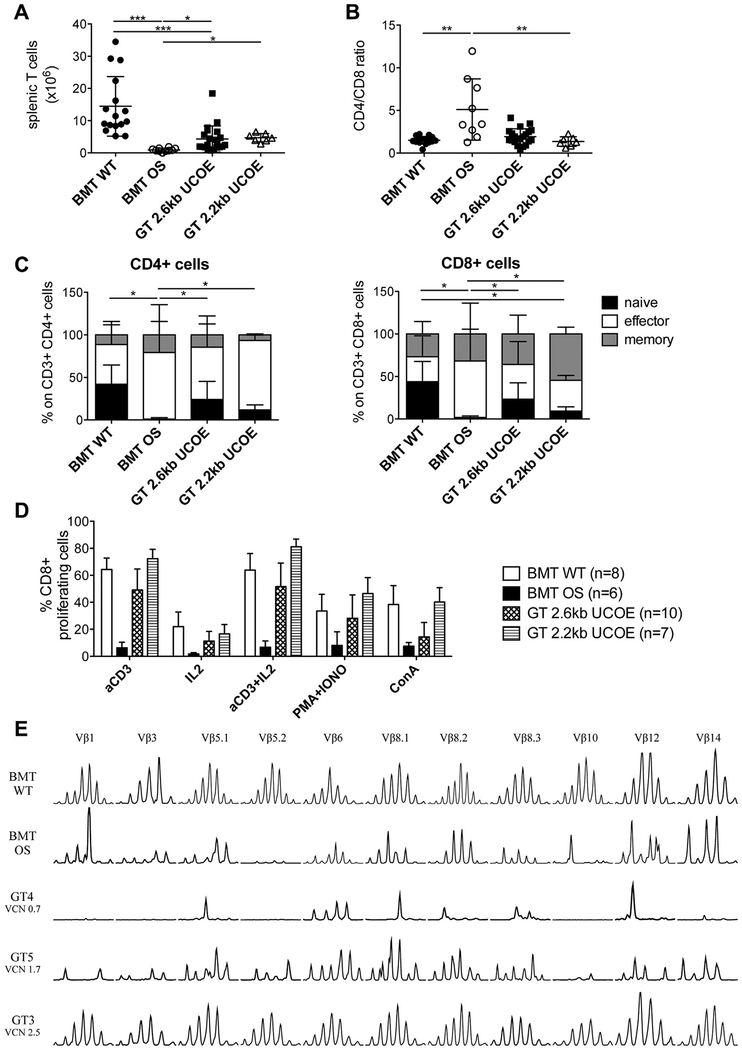
FIG 4.
T-cell development and functionality. A, Absolute counts of T cells. B, Ratio between CD4+ and CD8+ T cells. C, Distribution of naive, effector, and memory subpopulations in CD4+ (left) and CD8+ (right) T cells. BMT WT mice, n = 16; BMT OS mice, n = 9; GT 2.6kbUCOE mice, n = 21; GT 2.2kbUCOE mice, n = 7. D, Percentage of CD8+ T cells that proliferate in response to the indicated stimuli. E, TCR repertoire analysis in spleen cells. Eleven Vβ families of representative BMT WT, BMT OS, and GT 2.6kbUCOE mice (with low, medium, and high VCN) are shown. Statistical significance was determined by using nonparametric 1-way ANOVA with the Dunn posttest (Fig 4, A and B) or the nonparametric combination test (Fig 4, C). *P < .05, **P < .01, and ***P < .001. All data show means ± SDs.

