FIG 6.
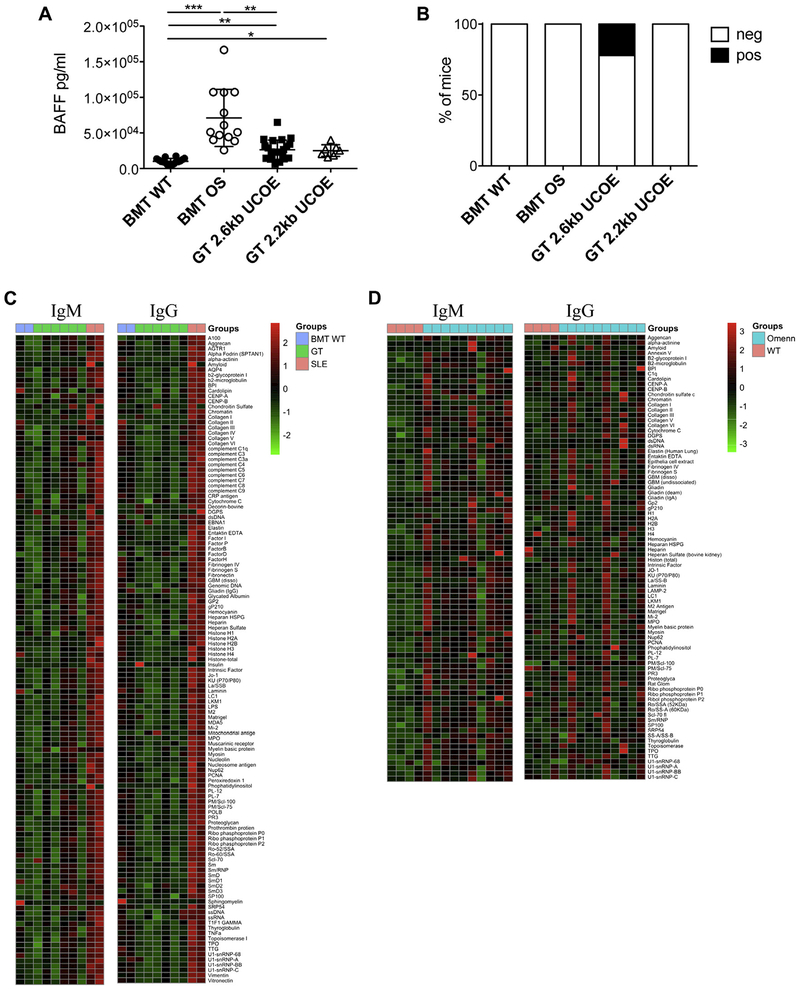
Autoimmune manifestations. A, BAFF levels in sera at the time of 28 weeks. Statistical significance was determined byusing nonparametric 1-way ANOVA with the Dunn posttest. *P < .05,**P < .01, and ***P < .001. B, Frequency of mice with the presence (white) or absence (black) of anti–double-stranded DNA autoantibodies in sera (BMT WT mice, n = 14; BMT OS mice, n = 10; GT 2.6kbUCOE mice, n = 18; GT 2.2kbUCOE mice, n = 5). C, Heat map representation of relative autoantibody IgM and IgG reactivity against 123 antigens tested in BMT WT, GT, and systemic lupus erythematosus (SLE) mice. Colors correspond to normalized (z-score) expression levels. D, Heat map representation of relative autoantibody IgM and IgG reactivity against 86 antigens tested in untreated WT and OS mice. Colors correspond to normalized (z-score) expression levels.

