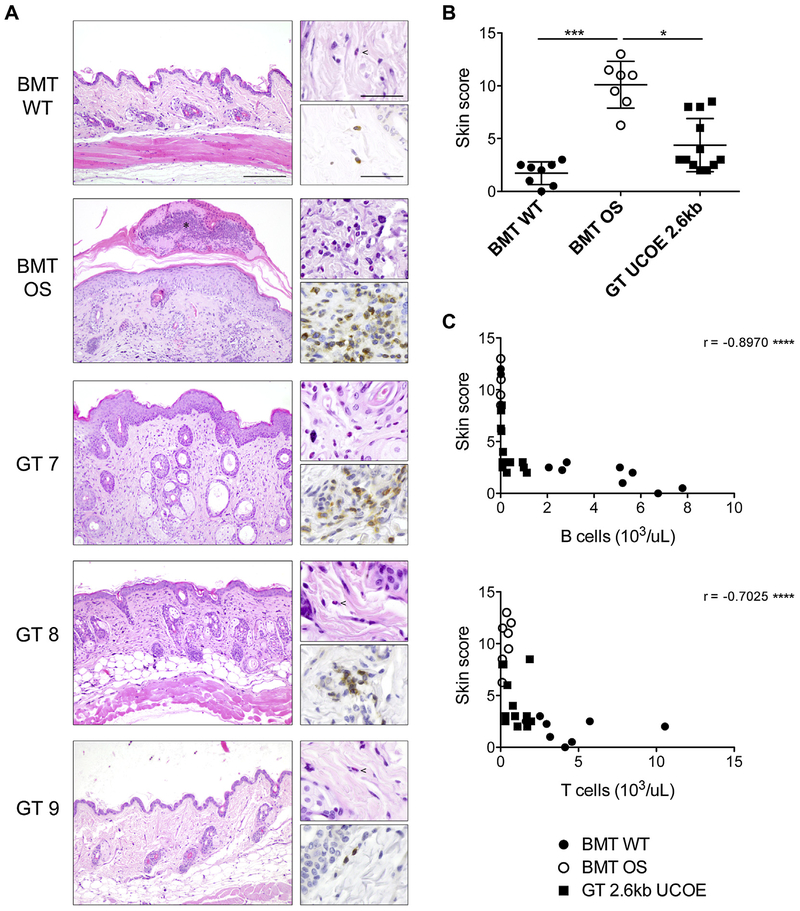
FIG 7.
Skin infiltration. A, Histologic analysis of skin sections stained with hematoxylin and eosin (left) of representative BMT WT, BMT OS, and GT 2.6kbUCOE mice. Upper right, Eosinophils are visible at higher magnification; lower right, T-cell infiltration is shown in CD3-stained sections. Scale bars = 200 μm (left) and 50 μm (right). B, Arbitrary score of skin manifestations calculated as described in the Methods section. C, Correlation between skin infiltration score and absolute count of B (top) and T (bottom) cells in the peripheral blood of BMT WT (solid circles), BMT OS (empty circles), and GT 2.6kbUCOE (squares) mice. The Spearman r value is indicated for each graph. Statistical significance was determined by using nonpara-metric 1-way ANOVA with the Dunn posttest (Fig 7, B) or by using Spearman correlation (Fig 7, C). *P < .05, **P < .01, ***P < .001, and ****P < .0001.

