
Fig. 6.
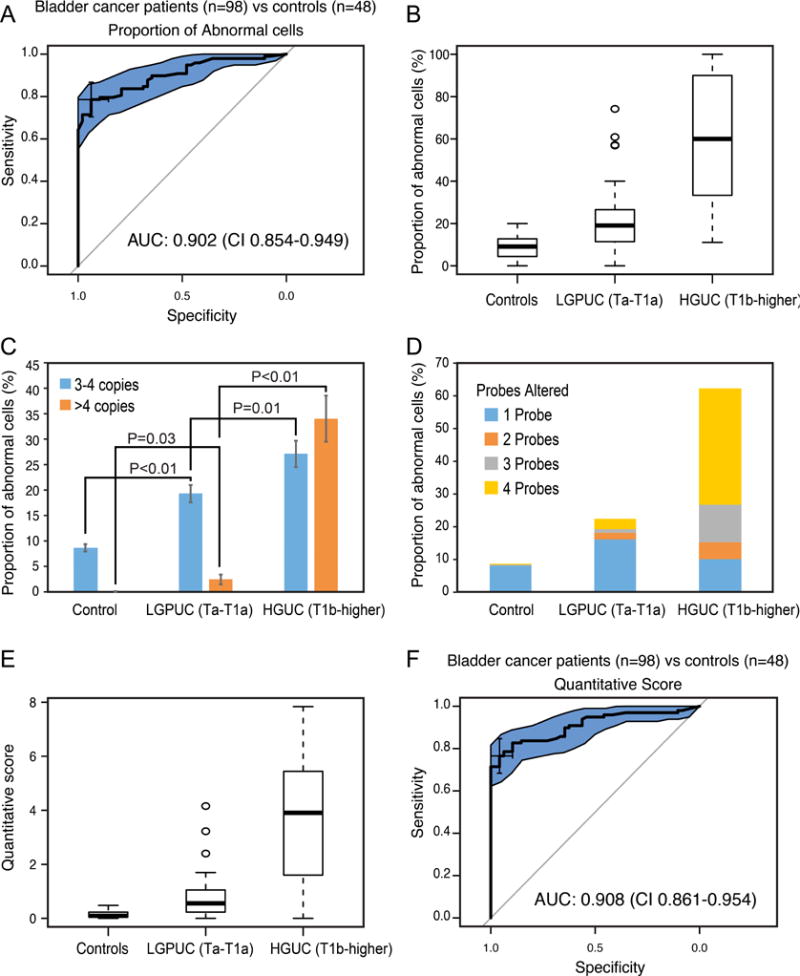
Detection of bladder cancer in voided urine by the quartet test (n = 146). (A) Receiver operating characteristic curve (ROC) based on the proportion of cells with abnormal copy numbers for the set consisting of 98 urine samples from patients with bladder cancer and 48 urine samples from control individuals (18 healthy controls and 30 with benign non-neoplastic disorders of the urinary tract). The quartet test for the detection of bladder cancer showed an area under the ROC curve (AUC) of 0.902 (95% confidence interval [CI] = 0.854–0.949). (B) Box plot analysis of mean percentage of abnormal cells in benign control samples and two groups of bladder cancer dichotomized into a superficial low-grade papillary carcinoma (LGPUC, Ta–T1a) and high-grade invasive carcinoma (HGUC, T1b–higher). (C) Average proportion of cells in voided urine showing three to four or more than four copies for at least one probe in benign controls (LGPUC [Ta–T1a] and HGUC [T1b–higher] groups of samples). (D) Average proportion of cells with increased copy numbers of one to four probes in benign controls (LGPUC [Ta–T1a] and HGUC [T1b–higher] groups of samples). (E) Box plot analysis of the QS values in benign controls (LGPUC [Ta–T1a] and HGUC [T1b–higher] groups of samples). (F) ROC based on the QS values for the set consisting of 98 urine samples from patients with bladder cancer and 48 urine samples from control individuals (18 healthy controls and 30 with benign non-neoplastic disorders of the urinary tract). The QS values of the quartet test for the detection of bladder cancer showed an AUC of 0.908 and CI = 0.861–0.954.
HGUC = high-grade urothelial carcinoma; LGPUC = low-grade papillary urothelial carcinoma; QS = quantitative score.