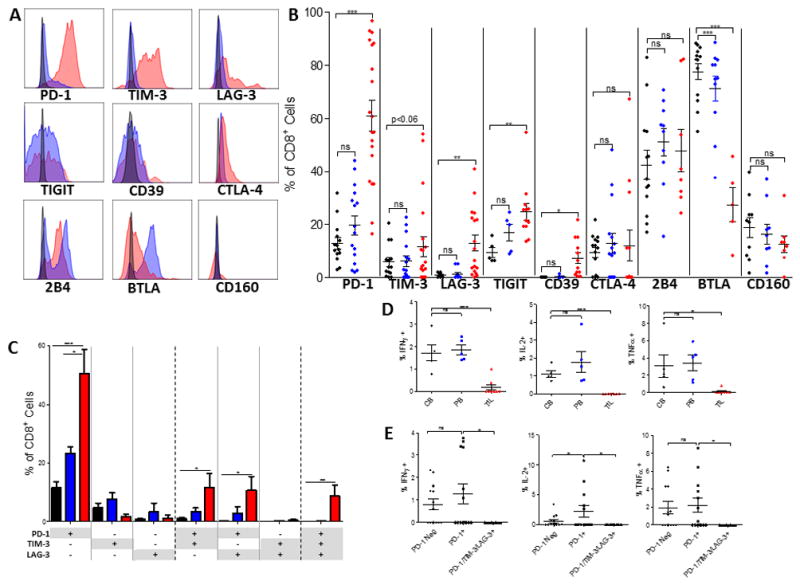
Figure 1. Elevated expression of checkpoint molecules and decreased cytokine production among TIL in human GBM.

A. Representative histograms of checkpoint molecule expression on CD8+ T cells where red represents patient TIL, blue represents patient blood, and black represents relevant isotype control. CTLA-4 is an intracellular stain. B. Frequency of checkpoint molecule expression on CD8+ T cells isolated from TIL (PD-1, TIM-3 n=20; LAG-3 n=18; CTLA-4 n=13; CD39, TIGIT n=12; CD160, 2B4 n=8; BTLA n=5), patient blood (PD-1, TIM-3 n=16; CTLA-4 n=15; 2B4, BTLA n=11; LAG-3 n=12; CD160 n=9; TIGIT, CD39 n=5), or control blood (PD-1, TIM-3, CTLA-4 n=14; LAG-3 n=10; 2B4, BTLA n=13; CD160 n=10; TIGIT, CD39 n=5). C. Boolean gating was performed on CD8+ T cells isolated from control and patient blood and patient tumors to determine co-expression of PD-1, TIM-3, and LAG-3. Sample numbers: control blood (n=9), patient blood (n=6), and patient TIL (n=5). Bar graphs represent mean +/− SEM. D. Post-stimulation with PMA/Ionomycin intracellular staining was performed on patient TIL, blood and control blood for IFN-γ, IL-2, and TNF-α. E. Boolean gating was employed to determine percentage of cells producing cytokines among T cells not expressing PD-1, PD-1 single positive, or PD-1/TIM-3/LAG-3 triple positive cells. B–D: red represents patient TIL, blue represents patient blood, and black represents control blood. Throughout figure *p<0.05; **p<0.01; ***p<0.0001 by unpaired t-test between control and patient samples.
