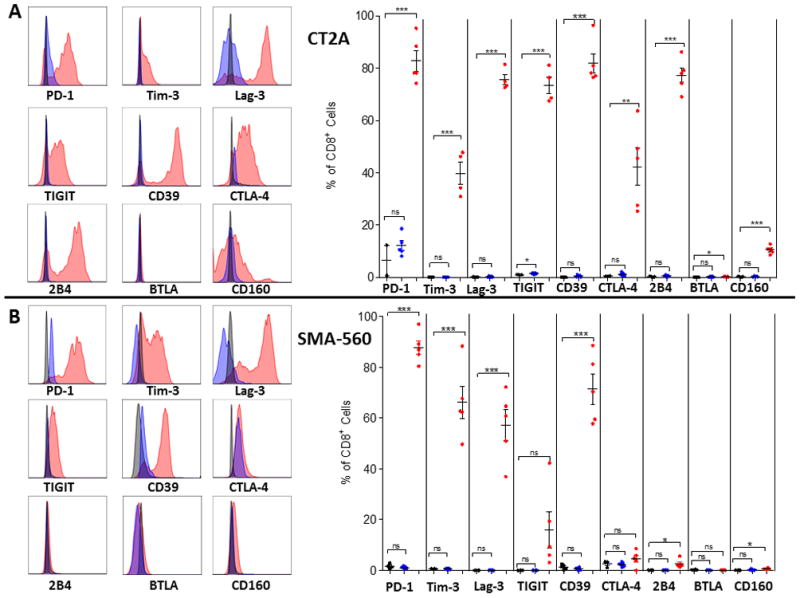
Figure 2. Expression of multiple checkpoint molecules among TIL in CT2A and SMA-560 murine glioma models.

Tumors and blood were harvested when mice were moribund at day 21 post intracranial tumor implantation (n=5) for CT2A (A) or SMA-560 (B) tumor models. Representative histograms of checkpoint molecule expression on CD8+ T cells are shown where red represents TIL, blue represents tumor-bearing blood, and black represents relevant isotype control. For graphs, red represents TIL, blue represents tumor-bearing blood, and black represents naïve blood. Significance was determined using unpaired t-test between control and tumor-bearing samples. *p<0.05; ***p<.001.
