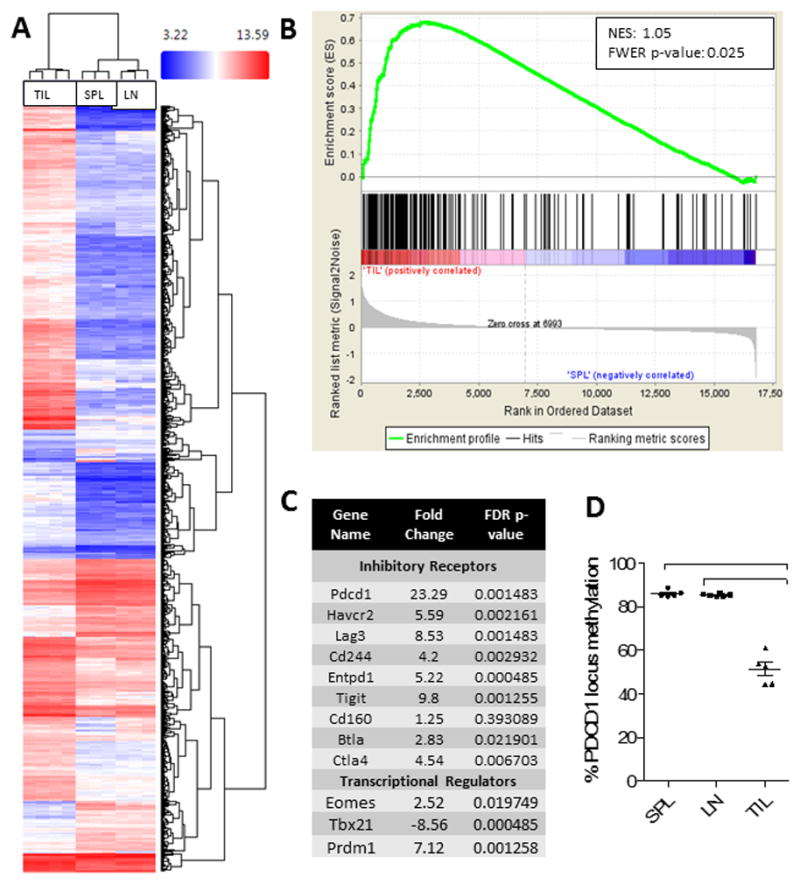
Figure 4. TIL demonstrate molecular signatures and epigenetic profiles consistent with T cell exhaustion.

A. A hierarchical cluster of gene expression of CD8+ T cells isolated from tumors (TIL), spleens (SPL), or tumor-draining cervical lymph nodes (LN). Microarray analysis was performed using the Affymetrix Clariom S Array Platform and clustering was performed on the 1071 genes which were screened from 22701 total. Comparisons were made via ANOVA; p-value <0.001 and FDR p-value <0.001 (all conditions). B. Gene Set Enrichment Analysis (GSEA) was performed with the software GSEA v2.2.3 downloaded from the Broad Institute. Gene sets assessed included GSE30962, publically available through the NCBI on Gene Expression Omnibus. NES = normalized enrichment score. C. Table demonstrating representative transcripts over- or under-represented in TIL compared to SPL. D. Analysis of methylation at the PD-1 promoter (Pdcd1) in CD8+ T cells from TIL, SPL, or LN via ANOVA with repeated measures followed by Bonferroni post-test ***p<0.0001.
