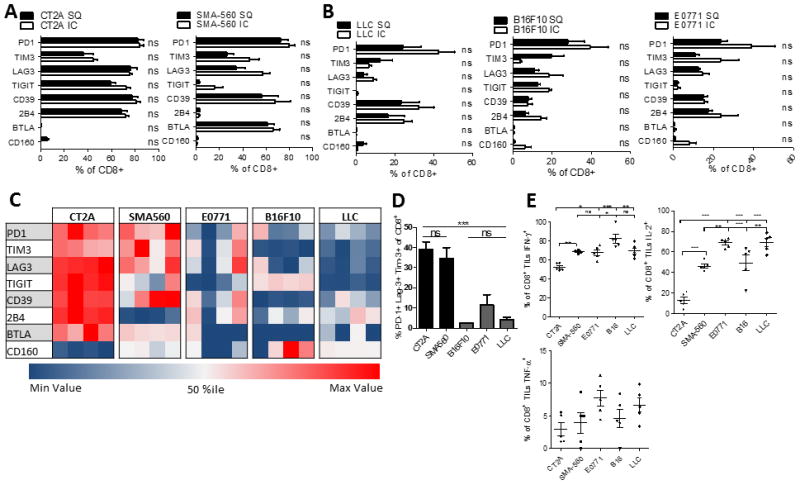
Figure 6. T cell exhaustion signatures reflect tumor histology rather than intracranial location and are particularly severe among malignant glioma.

A. The percentage of CD8+ T cells expressing immune checkpoints within either intracranial (IC) or subcutaneous (SC) CT2A and SMA-560 glioma models. TIL were isolated when mice bearing IC tumors (n=5) were moribund or when SC tumors (n=5) reached 20mm at the largest diameter. B. The percentage of CD8+ T cells expressing various immune checkpoints among IC or SC B16F10 (melanoma), E0771 (breast) and LLC (lung). C. Heat map representing the % of CD8+ TIL expressing immune checkpoints across five different models of IC malignancies (n=4). Each row represents one immune checkpoint with associated percentiles. Each column represents an individual mouse. D. The percentage of CD8+ TIL co-expressing PD-1, Tim-3, and Lag-3 across five different models of intracranial malignancies. Differences were assessed via one-way ANOVA with Tukey’s post hoc test. E. The percentage of CD8+ TIL staining for IFN-γ, IL-2, and TNF-α. *p<0.05; **p<0.01; ***p<0.0001.
