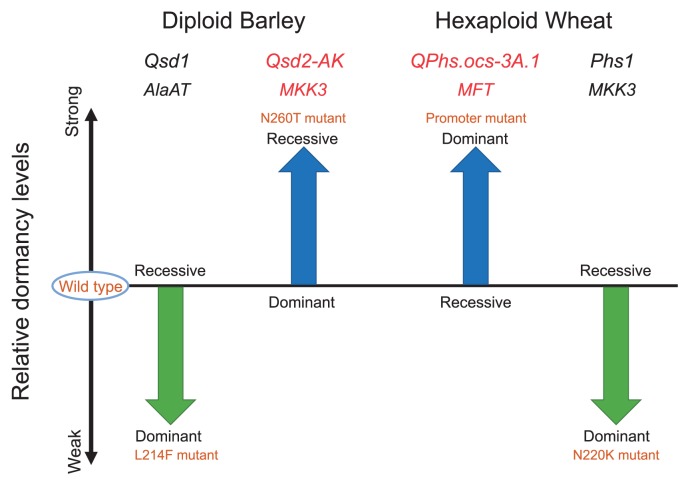
Fig. 2.
Dominance and relative effects of mutant alleles on dormancy. The relative levels of dormancy caused by each mutation are compared with those of the wild-type allele. The starting and the ending points (heads) of the arrows show the relative dormancy levels of the wild-type allele and the mutant allelele of each gene, respectively. The arrow’s length represents the qualitative effect of each QTL. Blue arrows show increasing dormancy levels produced by the mutations. Green arrows show decreasing dormancy levels produced by the mutaions. Red and black letters of the QTL and gene names indicate the mutations were estimated to have originated in East Asia and West Asia, respectively.

