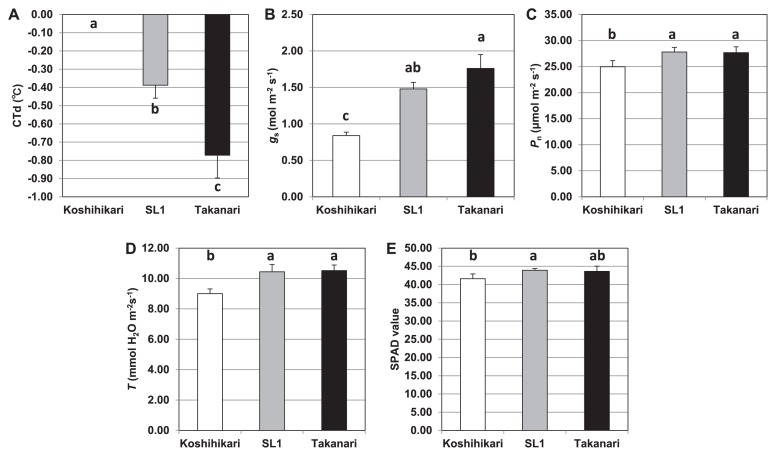
Fig. 8.
Comparison of canopy temperature differences (CTds) between ‘Koshihikari’ and SL1, or ‘Takanari’ and leaf photosynthesis in ‘Koshihikari’ and SL1, or ‘Takanari’. CTds (A) were measured at 53 days after transplanting in 2015. Stomatal conductance (gs) (B), leaf photosynthetic rate (Pn) (C), transpiration rate (T) (D), and soil-plant analysis development (SPAD) value (E) per leaf area in each topmost expanded leaf of the main culm of ‘Koshihikari’, SL1, and ‘Takanari’ grown in pots were determined on the same day as the CTd measurements. All plants were evaluated before heading. Values are means ± S.D. (A, n = 9; B–E, n = 3 or 4). Different letters indicate significant differences (P < 0.05; Tukey’s honest significant difference test).

