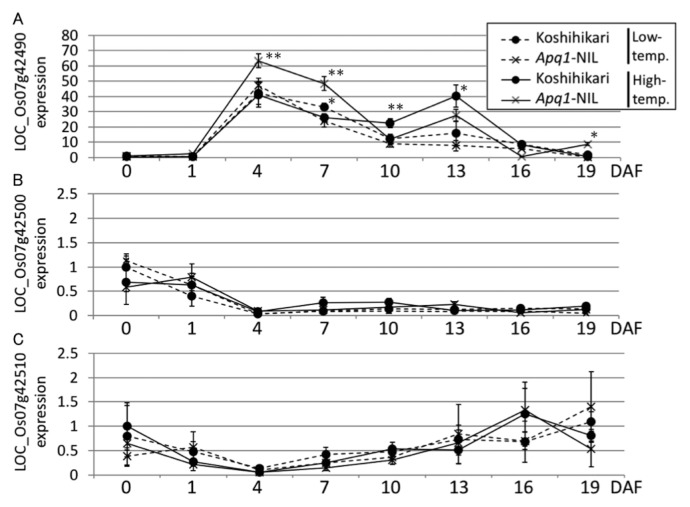
Fig. 3.
Expression analysis of Apq1 candidate genes. Relative expression of three candidate genes of Apq1 in endosperms grown under low- and high-temperature conditions was calculated using OsUbi1 as an internal control and was normalized to the expression level in samples of ‘Koshihikari’ at 0 DAF. LOC_Os07g42490, LOC_Os07g42500, and LOC_Os07g42510 are shown in (A), (B), and (C), respectively. Error bars indicate standard deviations. Student’s t-test was performed between ‘Koshihikari’ and Apq1-NIL under the same temperature condition. ** p < 0.01, * p < 0.05.

