Fig. 4.
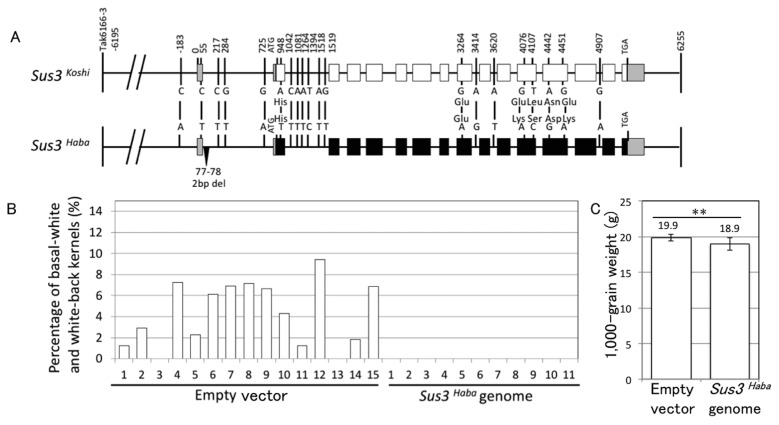
Complementation test of Apq1. (A) DNA sequence polymorphisms of Sus3 in ‘Koshihikari’, Sus3Koshi, and ‘Habataki’, Sus3Haba. White and black boxes indicate protein-coding regions of ‘Koshihikari’ and ‘Habataki’, respectively. Gray boxes indicate UTRs. Numbers indicate positions of polymorphism from the transcription start site of Sus3. (B) High-temperature treatment test of Sus3Haba-transformed plants. Empty vector- and Sus3Haba-transformed ‘Nipponbare’ were grown under high-temperature condition the during ripening stage. The percentages of basal-white and white-back kernels were measured to compare high-temperature tolerance. Independently obtained empty vector-transformed (n = 15) and Sus3Haba-transformed (n = 11) plants were tested. (C) Average of 1,000-grain weight (dry-weight) of transgenic plants. ** p < 0.01 (Student’s t-test).

