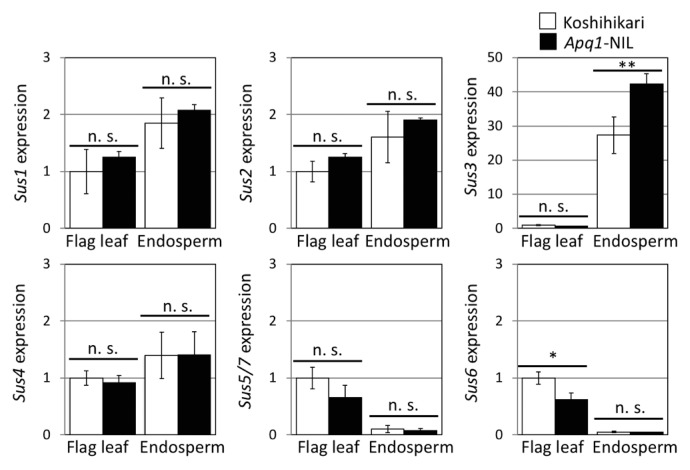
Fig. 6.
Expression analysis of Sus genes in rice. Expression levels of all seven Sus genes in flag leaf and endosperm under the high-temperature condition were compared at 4 DAF. White and black bars indicate ‘Koshihikari’ and Apq1-NIL, respectively. Because of the highly similar mRNA sequences of Sus5 and Sus7, the expression was measured using a common sequence primer set. Gene expression was calculated using OsUbi1 as an internal control and was normalized to the expression level in the flag leaf of ‘Koshihikari’. Error bars indicate standard deviations. ** p < 0.01, * p < 0.05 (Student’s t-test), n > 3.

