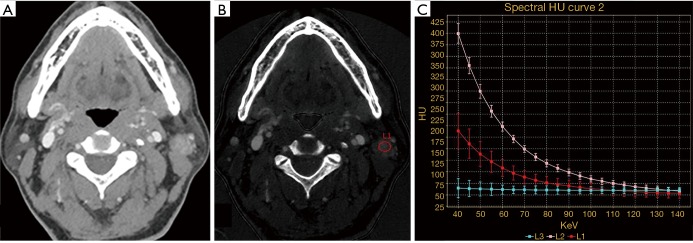
Figure 2.
A 50-year-old male patient with WT. (A) Transverse 70 keV images after enhancement. The tumor locates in the left lobe of parotid gland with clear border and marked enhancement; (B) iodine-based MD images and (C) the spectral HU curves are the tumor (L1, the red curve), CCA (L2, the pink curve) and sternocleidomastoid muscle (L3, the blue curve) respectively. The IC, NIC and λHU are 2.00 mg/mL, 0.48 and 2.37, respectively. WT, Warthin tumor; MD, material decomposition; CCA, common carotid arteries; IC, iodine concentration; NIC, normalized iodine concentration.

