Abstract
Background
To determine the accuracy of synchrotron radiation computed tomography (CT) for measurement of stent wire diameters for in vitro simulation of endovascular aneurysm repair by four different types of stent grafts when compared to conventional CT images.
Methods
This study was performed using an aorta model with implantation of four aortic stent grafts for endovascular treatment of thoracoabdominal and abdominal aortic aneurysms. The aorta model was scanned using synchrotron radiation CT with beam energies ranging from 60 to 90 keV with 10 keV increment at each scan and spatial resolution of 41.6 µm per pixel. Stent wire diameters were measured at the top and body regions of each stent graft based on 2-dimensional (2D) axial and 3-dimensional (3D) reconstruction images, with measurements compared to those obtained from 128-slice CT images which were acquired with slice thickness of 0.5 mm.
Results
Synchrotron radiation CT images clearly demonstrated stent graft details with accurate assessment of stent wire diameters, with measurements at the top of stent grafts (between 0.32±0.02 and 0.47±0.02 mm) similar to the actual diameters (between 0.32±0.01 and 0.48±0.01 mm) when the beam energies of 70 and 80 keV were used, regardless of the types of stent grafts assessed. A beam energy of 60 keV resulted in stent wires thicker than the actual sizes, although this did not reach statistical significance (P=0.07–0.29), while the beam energy of 90 keV led to stent wires smaller than the actual sizes at the top (P=0.16) and body region (P=0.02) of stent grafts on 2D axial images. The stent wire sizes measured at the body region of stent grafts on 3D synchrotron radiation images (between 0.19±0.02 and 0.43±0.02 mm) were significantly smaller than the actual diameters (P=0.02–0.04). Stent wires were overestimated on conventional CT images with diameters more than 2-fold larger than the actual sizes (P=0.007–0.03) at both top and body regions of all four stent grafts.
Conclusions
This study further confirms the accuracy of high-resolution synchrotron radiation CT in image visualization and size measurement of different aortic stent grafts with measured wire diameters similar to the actual ones, thus allowing for more accurate assessment of stent wire details for endovascular repair of aortic aneurysms.
Keywords: Aortic aneurysm, computed tomography (CT), interventional, stent graft, synchrotron radiation
Introduction
Endovascular aortic repair (EVAR) by use of stent grafts is a widely available, less-invasive procedure for treatment of patients having thoracoabdominal and abdominal aortic aneurysms, with clinical benefits of lower risk of procedure-related mortality when compared to open surgical repair (1-6). Further, the cost of EVAR appears lower than open surgery of aortic aneurysms (7,8). Technical developments of aortic stent grafts over the last decades have enabled EVAR to treat patients with complex aortic aneurysms such as the use of fenestrated and branched aortic stent grafts for preservation of renal and visceral arterial branches (6,9-11), thus improving the durability and safety of the implanted endovascular stent grafts.
Patients receiving EVAR undergo regular imaging follow-up to check the patency of arteries and the diameter of aortic aneurysms, and to determine whether the aortic aneurysms are completely excluded from the systemic circulation, and whether the stent grafts are deployed properly in relation to the renal and other visceral arteries. Among various imaging modalities, computed tomography angiography (CTA) is the preferred imaging technique for postoperative follow-up of EVAR, with low-dose CTA protocols reported to reduce cumulative radiation dose (12-15). With improvements in computed tomography (CT) scanning techniques, the spatial resolution of latest multi-detector row CT scanners is between 230 and 500 µm, which enables accurate assessment of anatomical structures and pathologies such as coronary arteries and plaque features (16-18). However, CT images acquired with the current scanners still suffer from beam hardening and blooming artifacts when imaging aortic stent wires, which result in overestimation of wire thickness as reported in our previous studies (19-22).
The limitation of inferior spatial resolution of current CT systems can be overcome by synchrotron radiation CT due to its advantage of superior spatial resolution, which is more than ten times higher than the most recent CT scanners (23,24). Our recent studies have shown the accuracy of synchrotron radiation CT for accurate assessment of stent wires and cross-sectional area reduction caused by aortic stent grafts (25,26). However, the study was limited to only imaging one particular type of stent graft. The purpose of this study was to determine the accuracy of measuring the diameters of stent wires shown on synchrotron radiation CT images of four different types of aortic stent grafts that were commonly used to treat thoracoabdominal and abdominal aortic aneurysms. This study further expanded our previous reports to assess stent grafts with different designs of the top/uncovered stents and body part of the stent grafts.
Methods
Aorta model and stent grafts
An aortic model consisting of ascending aorta, aortic arch and abdominal aorta down to iliac bifurcation made by silicon was used in this study to simulate EVAR. Two aortic aneurysms were simulated in the model, with ascending and descending ones being 4.5 and 5.5 cm respectively (Figure 1). The model was produced by pouring silicon onto a mould. The mould was then removed once the silicon was solidified.
Figure 1.
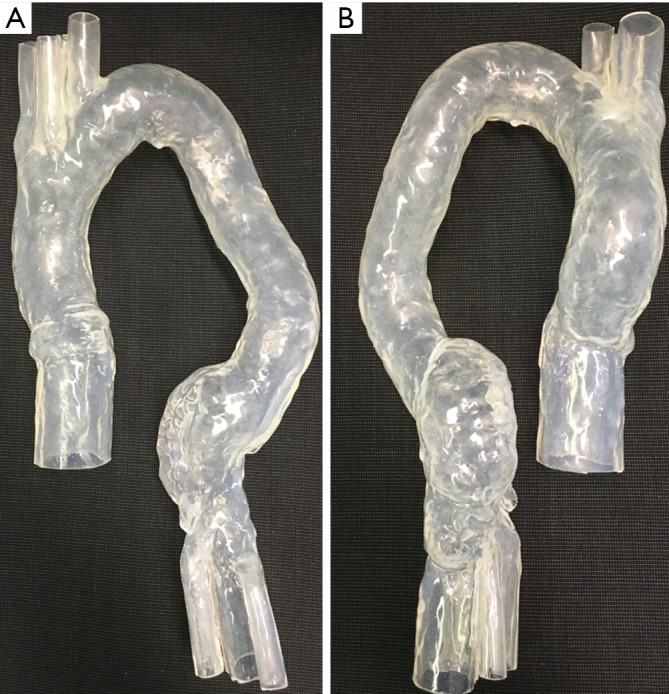
Aortic model used for simulation of endovascular aneurysm repair. (A) Anterior view of the silicon model consisting of ascending aorta, aortic arch with 3 main arterial branches and descending aorta down to the bifurcation; (B) posterior view of the model with simulated aneurysms in ascending and descending aorta.
Four different aortic stent grafts (A–D) were used in this study (Figure 2). All of these aortic stent grafts were manufactured with Cook Zenith system (William A. Cook, Brisbane, Australia) and they were commercially available products that were used to treat patients with different types of aortic aneurysms. Details of these stent grafts regarding their applications in treating aortic aneurysms are shown in the following:
Figure 2.
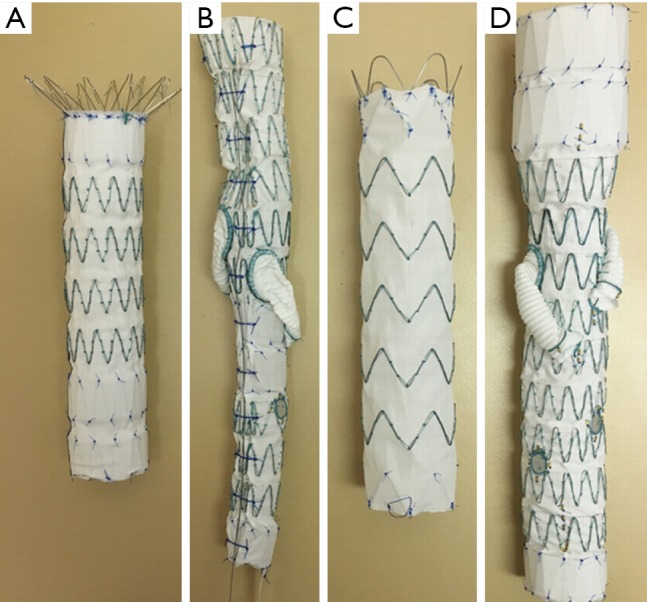
Four different aortic stent grafts (A–D) that were used in the experiments.
❖ Zenith TX2 distal thoracic component;
❖ Thoracoabdominal with helical side-branches and fenestrations;
❖ Zenith Alpha proximal component with low profile material;
❖ Thoracoabdominal with helical side-branches and fenestrations.
Stent graft B was intended to land inside the distal end of another graft, either pre-existing or placed just before graft B while stent graft D was a standalone graft intended to seal into native anatomy at both ends. Two stent grafts (A and B) were first placed together inside the aorta model with one in the ascending aortic aneurysm and the other in the descending aortic aneurysm, followed by CT image acquisition. The same stent graft placement and image acquisition approach was used for stent grafts C and D as well. Thus, each CT image dataset contains 2 types of stent graft details. Figure 3A is an example showing simulated implantation of stent grafts A and B in the aorta model, while Figure 3B shows stent grafts C and D placed inside the aorta with foam used to support the model during synchrotron radiation CT imaging.
Figure 3.
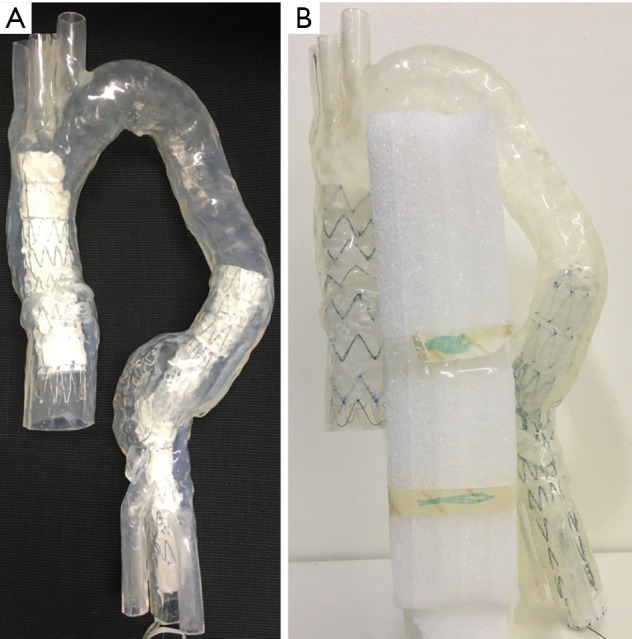
Simulation of endovascular aneurysm repair during experiments. (A) Stent grafts A and B were placed inside the aorta model; (B) stent grafts C and D were placed inside the aorta model with use of foam to support the aorta arch for fixing its position during synchrotron radiation CT imaging.
Synchrotron radiation CT scans
Synchrotron radiation CT imaging was conducted at the Australian Synchrotron in Melbourne using the Imaging and Medical Beamline (IMBL). Details of experimental setup and imaging characteristics of IMBL have been described in our previous studies (25,26). The synchrotron radiation CT images were acquired with a pixel size of 41.6 µm and beam energies ranging from 60 to 90 keV with 10 keV increment at each scan. The purpose of selecting different beam energies was to determine the effect of energies on the visualization of stent wires and identify optimal energy range for synchrotron radiation CT imaging of aortic stent grafts. The rationale of choosing 60 keV as the minimal beam energy and 90 keV as the maximum was based on our previous study findings, beam energy lower than 60 keV resulting in suboptimal visualization of stent wires, while beam energy higher than 90 keV leading to disruption of wire structures (25,26). To ensure that the model did not move during synchrotron radiation CT imaging, the model was immobilized by foam boards fixed to the centre of IMBL scan table as shown in Figure 4.
Figure 4.
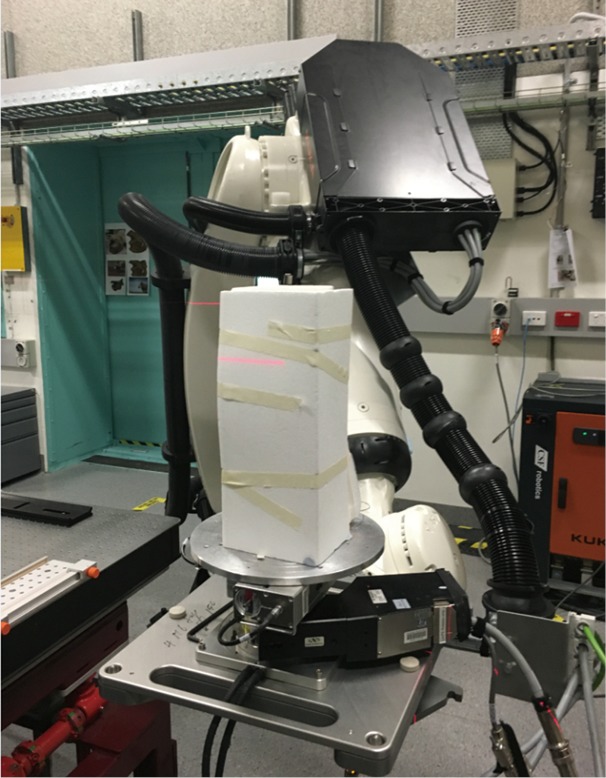
Experimental setup during synchrotron radiation. Foam boards were used to fix the aorta model with the aim of providing support to keep aorta model stable during synchrotron radiation CT imaging.
Conventional CTA scans
CTA scans of the aorta model with stent grafts placed in the ascending and descending aorta were performed on a second generation of 128-slice dual-source CT (Siemens Definition Flash, Siemens Healthcare, Forchheim, Germany). CT scanning protocol was as follows: detector collimation: 2×64×0.6 mm, 80 kVp, automatic tube current modulation, pitch: 1.2 and slice thickness: 0.5 mm with reconstruction interval of 0.25 mm. The voxel size of volumetric data was 0.48×0.48×0.48 mm3. To simulate CTA of abdominal aorta and follow-up imaging of aortic stent grafting, the aorta model was immersed in a plastic container which was filled with contrast medium, Optiray 350 UltrajectTM (Mallinckrodt Pty Ltd, NSW, Australia). The contrast medium was diluted to 7% with CT attenuation being 250 HU, which was similar to the one in routine CTA scanning involving real patients.
Image post-processing and measurements
Synchrotron radiation CT images in TIFF (tagged image file format) and 128-slice CTA images in DICOM (Digital Imaging and Communications in Medicine) underwent post-processing and analysis on a workstation with use of Analyze 12.0 (AnalyzeDirect, Inc., Lexana, KS, USA). Original 2-dimensional (2D) axial images were converted into 3-dimensional (3D) volumetric data for image visualization and measurements. The stent wire diameters were measured at the top and body regions of aortic stent grafts based on 2D axial and 3D reconstruction images. Measurements were performed at three different wire locations and the mean values were used to indicate the stent wire diameters so as to minimise intra-observer disagreement. Measurements for synchrotron radiation CT images were performed by an observer (observer 1) with more than 20 years of experience in CTA and more than 5 years of experience in synchrotron radiation studies. Measurements for CTA images were independently conducted by two observers (observers 1 and 2, with more than 20 and 10 years of experience in CT imaging, respectively), with good correlation achieved between these measurements performed by two observers (r=0.69–0.73; P=0.008–0.013).
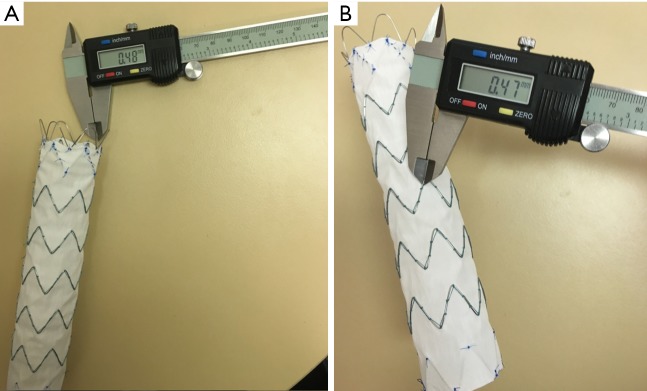
The actual wire diameters were measured at the top and body regions of these four aortic stent grafts. Similarly, measurements were performed at three different wire locations with the mean values used to indicate the diameters. Figure 5 shows an example of measuring stent wire diameters at the top and body of stent graft C using a digital caliper.
Figure 5.
Use of digital caliper to measure the stent wire diameters. Measurements were performed at the top (A) and body regions of the stent graft C (B).
Statistical analysis
Statistical analyses were performed using SPSS software 24.0 (IBM Corporation, Armonk, NY, USA). Descriptive data were given as the mean and standard deviation. Mean values of diameters of stent wires shown on synchrotron radiation CT and CTA images were compared using the Student t test. Statistically significant difference was assumed at P<0.05.
Results
Images acquired with synchrotron radiation provided more accurate assessment of wire diameters at the top and body regions of stent grafts, regardless of the types of stent grafts. The wire thicknesses were apparently affected by beam energies of synchrotron radiation with low energy resulting in slightly overestimated wire thicknesses, and high energy leading to wire diameters smaller than the actual sizes (Tables 1,2).
Table 1. Measurements of stent wire diameters on 2D axial images acquired using synchrotron radiation with beam energies ranging from 60 to 90 keV and 128-slice CT.
| Scanning protocols | Stent graft A (mm) | Stent graft B (mm) | Stent graft C (mm) | Stent graft D (mm) | |||||||
|---|---|---|---|---|---|---|---|---|---|---|---|
| Top | Body | Top | Body | Top | Body | Top | Body | ||||
| 60 keV | 0.48±0.02 | 0.36±0.01 | 0.41±0.01 | 0.42±0.04 | 0.55±0.02 | 0.46±0.02 | 0.53±0.02 | 0.48±0.02 | |||
| 70 keV | 0.37±0.01 | 0.29±0.01 | 0.38±0.01 | 0.33±0.01 | 0.46±0.02 | 0.44±0.02 | 0.44±0.02 | 0.31±0.02 | |||
| 80 keV | 0.32±0.02 | 0.28±0.02 | 0.36±0.02 | 0.33±0.01 | 0.43±0.01 | 0.44±0.01 | 0.45±0.01 | 0.32±0.01 | |||
| 90 keV | 0.30±0.01 | 0.25±0.01 | 0.34±0.01 | 0.25±0.00 | 0.44±0.02 | 0.40±0.01 | 0.44±0.01 | 0.27±0.04 | |||
| 128-slice CT* | 2.11±0.28/ 2.10±0.26 |
2.44±0.00/ 2.21±0.21 |
2.44±0.00/ 2.13±0.26 |
1.46±0.00/ 1.52±0.11 |
2.11±0.28/ 1.99±0.03 |
1.95±0.00/ 1.81±0.23 |
1.95±0.00/ 1.97±0.03 |
1.95±0.00/ 1.97±0.03 |
|||
| Actual diameters | 0.34±0.01 | 0.34±0.01 | 0.39±0.01 | 0.32±0.01 | 0.48±0.01 | 0.48±0.01 | 0.48±0.01 | 0.33±0.01 | |||
*Refers to measurements of stent wires on 128-slice CT by 2 separate observers.
Table 2. Measurements of stent wire diameters on 3D images acquired using synchrotron radiation with beam energies ranging from 60 to 90 keV and 128-slice CT.
| Scanning protocols | Stent graft A (mm) | Stent graft B (mm) | Stent graft C (mm) | Stent graft D (mm) | |||||||
|---|---|---|---|---|---|---|---|---|---|---|---|
| Top | Body | Top | Body | Top | Body | Top | Body | ||||
| 60 keV | 0.43±0.02 | 0.32±0.01 | 0.54±0.02 | 0.36±0.03 | 0.60±0.03 | 0.43±0.02 | 0.59±0.01 | 0.31±0.01 | |||
| 70 keV | 0.36±0.03 | 0.28±0.01 | 0.39±0.03 | 0.28±0.01 | 0.47±0.02 | 0.35±0.01 | 0.44±0.02 | 0.26±0.01 | |||
| 80 keV | 0.34±0.02 | 0.26±0.01 | 0.33±0.01 | 0.26±0.03 | 0.46±0.02 | 0.36±0.01 | 0.47±0.01 | 0.24±0.01 | |||
| 90 keV | 0.27±0.02 | 0.23±0.02 | 0.30±0.03 | 0.27±0.03 | 0.34±0.02 | 0.31±0.01 | 0.38±0.01 | 0.19±0.02 | |||
| 128-slice CT* | 1.05±0.07/ 1.05±0.12 |
1.05±0.12/ 1.16±0.06 |
1.12±0.06/ 1.37±0.15 |
0.76±0.31/ 0.85±0.32 |
0.98±0.00/ 1.25±0.11 |
1.05±0.81/ 1.17±0.31 |
1.01±0.07/ 0.92±0.20 |
0.72±0.24/ 0.76±0.30 |
|||
| Actual diameters | 0.34±0.01 | 0.34±0.01 | 0.39±0.01 | 0.32±0.01 | 0.48±0.01 | 0.48±0.01 | 0.48±0.01 | 0.33±0.01 | |||
*Refers to measurements of stent wires on 128-slice CT by 2 separate observers.
Of these four different stent grafts, the beam energies of 70 and 80 keV allow for more accurate assessment of wire diameters with measured thicknesses similar to the actual sizes of stent wires at the top and most of the body regions of stent grafts. Overall, the stent wire diameters at the top and body regions of stent grafts illustrated on images acquired with a beam energy of 60 keV were measured thicker than the actual ones although this did not reach statistically significant difference (P=0.07–0.29). Nearly all wire diameters measured at the body regions were significantly smaller than the actual sizes when the beam energy was higher than 60 keV (P=0.02–0.04). This is especially apparent on 3D images of the body regions of stent grafts as most of the wire diameters were smaller than the actual sizes, even on images acquired with 60 keV. The wire diameters became much smaller than the actual ones when beam energy was increased to 90 keV (Table 2).
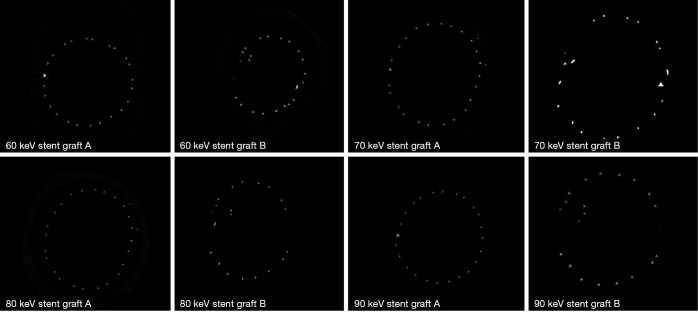
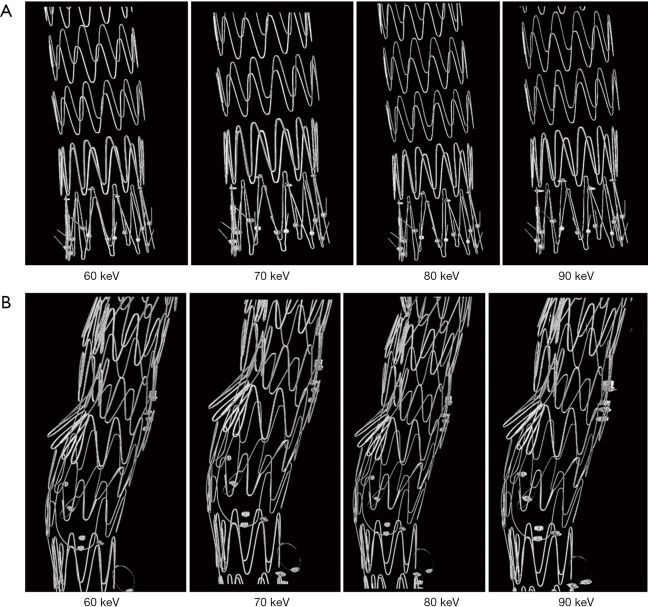
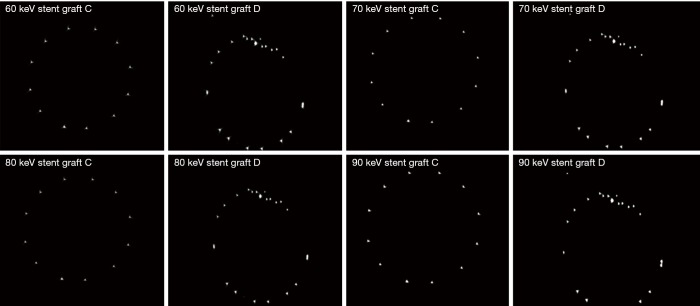
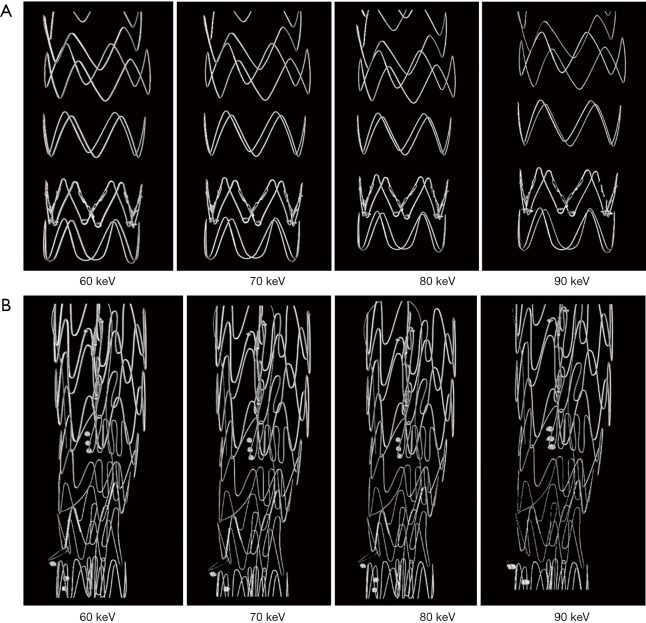
Figure 6 shows a series of synchrotron radiation 2D axial images of the body regions of stent grafts A and B acquired with different beam energies ranging from 60 to 90 keV, while Figure 7 shows synchrotron radiation 3D images of these 2 stent grafts. Figure 8 presents a series of synchrotron radiation 2D axial images of the top regions of stent grafts C and D acquired with different beam energies ranging from 60 to 90 keV, and Figure 9 demonstrates synchrotron radiation 3D images of these stent grafts. Stent wire details are clearly visualized on these synchrotron radiation images. When beam energy was increased to 90 keV, some stent structures were disrupted as shown in Figure 9.
Figure 6.
Synchrotron radiation 2D axial images of stent grafts A and B with use of different beam energies ranging from 60 to 90 keV at the body of stent grafts.
Figure 7.
Synchrotron radiation 3D imaging of stent grafts with excellent demonstration of stent wire structures. 3D imaging of stent grafts A and B (Figure 7A,7B respectively) with use of different beam energies ranging from 60 to 90 keV.
Figure 8.
Synchrotron radiation 2D axial images of stent grafts C and D with use of different beam energies ranging from 60 to 90 keV at the top of stent grafts.
Figure 9.
Synchrotron radiation 3D imaging of stent grafts C and D with excellent demonstration of stent wire structures. 3D imaging of stent grafts C and D (Figure 9A,9B respectively) with use of different beam energies ranging from 60 to 90 keV.
In comparison with synchrotron radiation images, CT images acquired with 128-slice scanner lacked of providing wire structure details with wire diameters measured significantly larger than the actual sizes. The wire diameters measured on synchrotron radiation images were found to be significantly smaller than those on conventional CT images, regardless of the range of beam energies used or the locations of the stent grafts (P=0.007–0.03). The stent wire diameters were overestimated to a greater extent on both 2D axial and 3D reconstruction conventional CT images for all types of stent grafts. The stent wire diameters measured on conventional CT images were at least 2–3 fold thicker than the actual sizes, as shown in Tables 1,2. Figures 10,11 show 2D axial conventional CT images of stent wires, 3D surface shaded display of the aorta model with stent grafts placed in the ascending and descending aorta and 3D visualization of stent grafts, respectively. The wire diameters were significantly larger than the actual sizes at the top and body regions of these stent grafts on the conventional CT images (P<0.001).
Figure 10.
128-slice CT images of stent grafts A and B. (A) 2D axial images of stent wires at the body of stent grafts; (B) 3D surface shaded display showing aorta model with stent grafts A and B placed in the aorta; (C) 3D visualization of stent wires of these 2 stent grafts.
Figure 11.
128-slice CT images of stent grafts C and D. (A) 2D axial images of stent wires at the top of stent grafts; (B) 3D surface shaded display showing aorta model with stent grafts C and D placed in the aorta; (C) 3D visualization of stent wires of these 2 stent grafts. In comparison with synchrotron radiation images as shown in Figures 7,9, 128-slice CT images were inferior to synchrotron radiation ones with regard to displaying fine details of stent wires.
Discussion
This study further confirms the superiority of synchrotron radiation CT imaging over conventional CT imaging in the assessment of aortic stent grafts with high accuracy of measuring sizes of stent graft structures. Findings of this study show that synchrotron radiation allows for more accurate assessment of stent wires with wire diameters measured similar to the actual sizes in most of the measured locations when beam energies of 70 and 80 keV were selected. In contrast, despite the use of thin slice thickness of 0.5 mm, conventional CT images still significantly overestimate the stent wire sizes, with measured diameters larger than the actual ones, irrespective of locations or types of stent grafts.
Short to mid-term outcomes of EVAR have been satisfactory due to its less invasiveness and low rate of complications associated with the procedure when compared to invasive open surgery (1-4,6-8). The long-term safety of EVAR depends on regular imaging follow-ups, with a focus on the patency of visceral artery branches due to implantation of modified stent grafts for dealing with complex aortic aneurysms. Recent single and multicenter studies have reported the feasibility and durability of using fenestrated and branched endovascular stent grafts in the treatment of juxta/suprarenal aortic aneurysms or thoracoabdominal aortic aneurysms (27-29). However, long-term follow-up of these stent grafts is necessary to determine the impact of these modified stent grafts on preservation of blood flow to the aortic arteries and disease progression, as well as on device safety.
Previous studies by our group and others show that the interference of stent wires with hemodynamic flow to the renal arteries was minimal when suprarenal or fenestrated stent grafts were placed inside the abdominal aorta (30-32). With accumulation of blood cells on the stent surface, the wire could become thicker than the original size, thus resulting in a potential risk of reducing cross-sectional area of the renal artery ostium (33,34). Current conventional CT systems lack the ability to accurately assess wire diameters due to inferior spatial resolution, with overestimation of wire diameters to more than 2-fold than the actual sizes. This is confirmed in this study and previous reports with measured wire diameters ranging from 0.7 to 2.44 mm, while the actual stent wire sizes were measured between 0.32 and 0.48 mm (25,26). Therefore, routine CT imaging is a useful technique for follow-up of position of stent grafts in relation to the aortic branches, and patency of stented vessels, but not for accurate assessment of wire diameters with regard to the hemodynamic effects on renal arteries or cross-sectional area reduction due to presence of stent wires across the renal artery ostium.
Synchrotron radiation CT represents a novel imaging technique with the ability of detecting very fine details owing to its superior resolution with many applications in different fields including in cardiovascular disease (23,24,35,36). Recent reports on animal experiments indicated the accuracy of synchrotron radiation CT in the visualization of cardiovascular structures such as assessment of fine details of coronary wall thickness (13.6–37.4 µm) and component analysis of atherosclerotic plaques (<30 µm for thin fibrotic cap) (37-39). Although the stent wires are less than 0.5 mm in diameter, the required imaging resolution to detect its dimensional change (minimal 20% change) is estimated to be 0.1 mm (40). This is beyond the ability of latest CT scanners as the best spatial resolution of most recent conventional CT scanners is between 0.23 and 0.5 mm. With superior resolution, synchrotron radiation CT is able to demonstrate macroscopic and microscopic details of stent grafts by producing high resolution 3D images (with resolution down to 1 µm), as shown in Figures 7,9. Synchrotron radiation CT improves our understanding of the structural components of aortic stent grafts by providing more accurate assessment of the stent wires in terms of dimensional change and relationship with other aortic branches. Despite its limitation as a research tool, synchrotron radiation in vitro experiments in this study and in ex vivo/in vivo in other animal studies allows for morphological assessment of cardiovascular structures and understanding pathogenesis of disease development and progression.
Several limitations in this study should be acknowledged. First, similar to our previous reports (25,26), no contrast medium was used in the synchrotron radiation imaging due to its superior spatial and contrast resolution. This did not affect our assessment of stent graft details on all of the images acquired with different beam energies. Second, we tested four different stent grafts including the most recently developed fenestrated and branched stent grafts, and these products were commercially available for treating thoracoabdominal and abdominal aortic aneurysms. However, these stent grafts were all manufactured by Cook Medical Australia, which is another limitation. Inclusion of other stent grafts from different manufacturers deserves to be investigated in further studies. Third, although the 3D silicon model replicates aortic anatomy and aneurysms with accuracy, use of 3D printed models with materials similar to normal tissue properties could be another option for simulating EVAR, given the rapid developments of 3D printing technology over the last few years (41-43). Finally, we conducted conventional CT scans of the model with implanted stent grafts with slice thickness of 0.5 mm, however, high spatial resolution imaging of 0.23–0.25 mm may prove to be superior to the current CT scanners. This could be performed in the near future when the high spatial resolution imaging is available in local clinical centers.
Conclusions
In conclusion, we have tested imaging of four different aortic stent grafts with various beam energies using synchrotron radiation and 128-slice CT. Synchrotron radiation CT enables accurate assessment of stent wire diameters with beam energies of 70 and 80 keV being the optimal protocol resulting in measured wire sizes similar to the actual wire diameters in most of the measurements. Despite improved spatial resolution with current conventional CT scanners, stent wire sizes are significantly overestimated on conventional CT images due to inferior spatial resolution.
Acknowledgements
Authors would like to thank Dr. Chris Hall and Dr. Anton Maksimenko from Australian Synchrotron for their advice and assistance in the experiments. We thank Mr. Werner Ducke from Cook Medical Australia for providing aortic stent grafts that were used in the experiments. Our sincere thanks go to Mr. Tom Tiang from Princess Margaret Hospital for his assistance in CT scanning of the aorta model. This study was undertaken on the Imaging and Medical Beamline at the Australian Synchrotron, Victoria, Australia.
Ethical Statement: This article didn’t involve patients or animals, so ethical review and informed consent are exempted.
Footnotes
Conflicts of Interest: The authors have no conflicts of interest to declare.
References
- 1.Greenhalgh RM, Brown LC, Kwong GP, Powell JT, Thompson SG, EVAR trial participants. Comparison of endovascular aneurysm repair with open repair in patients with abdominal aortic aneurysm (EVAR trial 1), 30-day operative mortality results: randomised controlled trial. Lancet 2004;364:843-8. 10.1016/S0140-6736(04)16979-1 [DOI] [PubMed] [Google Scholar]
- 2.Prinssen M, Verhoeven EL, Buth J, Cuypers PW, van Sambeek MR, Balm R, Buskens E, Grobbee DE, Blankensteijn JD, Dutch Randomized Endovascular Aneurysm Management (DREAM) Trial Group A randomized trial comparing conventional and endovascular repair of abdominal aortic aneurysms. N Engl J Med 2004;351:1607-18. 10.1056/NEJMoa042002 [DOI] [PubMed] [Google Scholar]
- 3.Harris PL, Vallabhaneni SR, Desgranges P, Becquemin JP, van Marrewijk C, Laheij RJ. Incidence and risk factors of late rupture, conversion, and death after endovascular repair of infrarenal aortic aneurysms: the EUROSTAR experience. J Vasc Surg 2000;32:739-49. 10.1067/mva.2000.109990 [DOI] [PubMed] [Google Scholar]
- 4.Brown LC, Greenhalgh RM, Thompson SG, Powell JT, EVAR Trial Participants Does EVAR alter the rate of cardiovascular events in patients with abdominal aortic aneurysm considered unfit for open repair? Results from the randomised EVAR trial 2. Eur J Vasc Endovasc Surg 2010;39:396-402. 10.1016/j.ejvs.2010.01.002 [DOI] [PubMed] [Google Scholar]
- 5.O’Donnell ME, Sun Z, Winder EJ, Ellis PK, Lau LL, Blair PH. Suprarenal fixation of endovascular aortic stent grafts: assessment of medium term to long-term renal function by analysis of juxtarenal stent morphology. J Vasc Surg 2007;45:694-700. 10.1016/j.jvs.2006.12.017 [DOI] [PubMed] [Google Scholar]
- 6.Sun Z, Mwipatayi BP, Semmens JB, Lawrence-Brown MM. Short to midterm outcomes of fenestrated endovascular grafts in the treatment of abdominal aortic aneurysms: a systematic review. J Endovasc Ther 2006;13:747-53. 10.1583/06-1919.1 [DOI] [PubMed] [Google Scholar]
- 7.Locham S, Dakour-Aridi H, Nejim B, Dhaliwal J, Alshwaily W, Malas M. Outcomes and cost of open versus endovascular repair of intact thoracoabdominal aortic aneurysm. J Vasc Surg 2018. [Epub ahead of print]. doi: . 10.1016/j.jvs.2018.01.053 [DOI] [PubMed] [Google Scholar]
- 8.Orandi BJ, Dimick JB, Deeb GM, Patel HJ, Upchurch GR., Jr A population-based analysis of endovascular versus open thoracic aortic aneurysm repair. J Vasc Surg 2009;49:1112-6. 10.1016/j.jvs.2008.12.024 [DOI] [PubMed] [Google Scholar]
- 9.Li W, Zhai S, Xu k, Li Q, Zhong H, Li T, Zhang Z. A feasibility study of a new unibody branches stent graft applied to reconstruct the canine aortic arch. Eur J Vasc Endovasc Surg 2018;55:842-50. 10.1016/j.ejvs.2018.02.021 [DOI] [PubMed] [Google Scholar]
- 10.Katsargyris A, Marques de Marino P, Mufty H, Pedro LM, Fernandes R, Verhoeven ELG. Early experience with the use of inner branches in endovascular repair of complex abdominal and thoraco-abdominal aortic aneurysms. Eur J Vasc Endovasc Surg 2018;55:640-6. 10.1016/j.ejvs.2018.01.024 [DOI] [PubMed] [Google Scholar]
- 11.Brinster CJ, Milner R. Fenestrated endovascular aortic repair and clinical trial devices for complex abdominal aortic aneurysms. J Cardiovasc Surg (Torino) 2018;59:342-59. [DOI] [PubMed] [Google Scholar]
- 12.Sun Z, Almoudi M, Cao Y. CT angiography in the diagnosis of cardiovascular disease: a transformation in cardiovascular CT practice. Quant Imaging Med Surg 2014;4:376-96. [DOI] [PMC free article] [PubMed] [Google Scholar]
- 13.Stavropoulos SW, Clark TW, Carpenter JP, Fairman RM, Litt H, Velazquez OC, Insko E, Farner M, Baum RA. Use of CT angiography to classify endoleaks after endovascular repair of abdominal aortic aneurysms. J Vasc Interv Radiol 2005;16:663-7. 10.1097/01.RVI.0000152386.97448.F1 [DOI] [PubMed] [Google Scholar]
- 14.Böning G, Rotzinger RA, Kahn JF, Freyhardt P, Renz DM, Maurer M, Streitparth F. Tailored CT angiography in follow-up after endovascular aneurysm repair (EVAR): combined dose reduction techniques. Acta Radiol 2018. [Epub ahead of print]. doi: . 10.1177/0284185118756952 [DOI] [PubMed] [Google Scholar]
- 15.Macchi M, Floridi C, Strocchi S, Fontana F, Mangini M, Piacentino F, Duka E, Donati AV, Fugazzola C. Role of low dose CT angiography in the follow-up after endovascular aneurysm repair of abdominal aorta. Acta Radiol 2015;56:1471-8. 10.1177/0284185114560210 [DOI] [PubMed] [Google Scholar]
- 16.Onishi H, Hori M, Ota T, Nakamoto A, Osuga K, Tatsumi M, Fukui H, Tsukagoshi S, Uranishi A, Saito Y, Taniguchi A, Enchi Y, Sato K, Tomiyama N. Phantom study of in-stent restenosis at high-spatial-resolution CT. Radiology 2018. [Epub ahead of print]. doi: . 10.1148/radiol.2018180188 [DOI] [PubMed] [Google Scholar]
- 17.Andreini D, Pontone G, Mushtaq S, Conte E, Perchinunno M, Guglielmo M, Volpato V, Annoni A, Baggiano A, Formenti A, Mancini ME, Beltrama V, Ditali V, Campari A, Fiorentini C, Bartorelli AL, Pepi M. Atrial fibrillation: Diagnostic accuracy of coronary CT angiography performed with a whole-heart 230-µm spatial resolution CT Scanner. Radiology 2017;284:676-84. 10.1148/radiol.2017161779 [DOI] [PubMed] [Google Scholar]
- 18.Pontone G, Bertella E, Mushtaq S, Loguercio M, Cortinovis S, Baggiano A, Conte E, Annoni A, Formenti A, Beltrama V, Guaricci AI, Andreini D. Coronary artery disease: diagnostic accuracy of CT coronary angiography--a comparison of high and standard spatial resolution scanning. Radiology 2014;271:688-94. 10.1148/radiol.13130909 [DOI] [PubMed] [Google Scholar]
- 19.Sun Z, Zheng H. Cross-sectional area reduction of the renal ostium by suprarenal stent wires: in vitro phantom study by CT virtual angioscopy. Comput Med Imaging Graph 2004;28:345-51. 10.1016/j.compmedimag.2004.05.003 [DOI] [PubMed] [Google Scholar]
- 20.Sun Z, Winder JR, Kelly BE, Ellis PK, Kennedy PT, Hirst DG. Assessment of VIE image quality using helical CT angiography: in vitro phantom study. Comput Med Imaging Graph 2004;28:3-12. 10.1016/j.compmedimag.2003.09.001 [DOI] [PubMed] [Google Scholar]
- 21.Sun Z, Gallagher E. Multislice CT virtual intravascular endoscopy for abdominal aortic aneurysm stent-grafts. J Vasc Interv Radiol 2004;15:961-70. 10.1097/01.RVI.0000140936.45313.EE [DOI] [PubMed] [Google Scholar]
- 22.Sun Z. Multislice CT angiography in post-aortic stent grafting: optimization of scanning protocols for virtual intravascular endoscopy. Int J CARS 2008;3:19-26. 10.1007/s11548-008-0201-1 [DOI] [Google Scholar]
- 23.Lewis R. Medical applications of synchrotron radiation x-rays. Phys Med Biol 1997;42:1213-43. 10.1088/0031-9155/42/7/001 [DOI] [PubMed] [Google Scholar]
- 24.Sun Z. The promise of synchrotron radiation in medical science. Australasian Med J 2009;1:1-5. 10.4066/AMJ.2009.68 [DOI] [Google Scholar]
- 25.Sun Z, Ng CKC. Synchrotron radiation imaging of aortic stent grafting: an in vitro phantom study. J Med Imaging Health Inform 2017;7:890-6. 10.1166/jmihi.2017.2094 [DOI] [Google Scholar]
- 26.Sun Z, Ng CKC. Use of synchrotron radiation to accurately assess cross-sectional area reduction of the aortic branch ostia caused by suprarenal stent wires. J Endovasc Ther 2017;24:870-9. 10.1177/1526602817732315 [DOI] [PubMed] [Google Scholar]
- 27.Budtz-Lilly J, Wanhainen A, Eriksson J, Mani K. Adapting to a total endovascular approach for complex aortic aneurysm repair: Outcomes after fenestrated and branched endovascular aortic repair. J Vasc Surg 2017;66:1349-56. 10.1016/j.jvs.2017.03.422 [DOI] [PubMed] [Google Scholar]
- 28.Oderich GS, Ribeiro M, Hofer J, Wigham J, Cha S, Chini J, Macedo TA, Gloviczki P. Prospective, nonrandomized study to evaluate endovascular repair of pararenal and thoracoabdominal aortic aneurysms using fenestrated-branched endografts based on supraceliac sealing zones. J Vasc Surg 2017;65:1249-59.e10. 10.1016/j.jvs.2016.09.038 [DOI] [PubMed] [Google Scholar]
- 29.Schanzer A, Simons JP, Flahive J, Durgin J, Aiello FA, Doucet D, Steppacher R, Messina LM. Outcomes of fenestrated and branched endovascular repair of complex abdominal and thoracoabdominal aortic aneurysms. J Vasc Surg 2017;66:687-94. 10.1016/j.jvs.2016.12.111 [DOI] [PubMed] [Google Scholar]
- 30.Liffman K, Lawrence-Brown MM, Semmens JB, Sutalo ID, Bui A, White F, Hartley DE. Suprarenal fixation: effect on blood flow of an endoluminal stent wire across an arterial orifice. J Endovasc Ther 2003;10:260-74. 10.1177/152660280301000216 [DOI] [PubMed] [Google Scholar]
- 31.Sun Z, Chaichana T. Investigation of hemodynamic effect of stent wires on renal arteries in patients with abdominal aortic aneurysms treated with suprarenal stent-grafts. Cardiovasc Intervent Radiol 2009;32:647-57. 10.1007/s00270-009-9539-1 [DOI] [PubMed] [Google Scholar]
- 32.Sun Z, Chaichana T. Fenestrated stent graft repair of abdominal aortic aneurysm: hemodynamic analysis of the effect of fenestrated stents on the renal arteries. Korean J Radiol 2010;11:95-106. 10.3348/kjr.2010.11.1.95 [DOI] [PMC free article] [PubMed] [Google Scholar]
- 33.Aristokleous N, Kontopodis NG, Tzirakis K, Ioannou CV, Papaharilaou Y. Hemodynamic impact of abdominal aortic aneurysm stentgraft implantation-induced stenosis. Med Biol Eng Comput 2016;54:1523-32. 10.1007/s11517-015-1425-1 [DOI] [PubMed] [Google Scholar]
- 34.Maleux G, Koolen M, Heye S, Heremans B, Nevelsteen A. Mural thrombotic deposits in abdominal aortic endografts are common and do not require additional treatment at short-term and midterm follow-up. J Vasc Interv Radiol 2008;19:1558-62. 10.1016/j.jvir.2008.08.007 [DOI] [PubMed] [Google Scholar]
- 35.Dix WR, Kupper W, Dill T, Hamm CW, Job H, Lohmann M, Reime B, Ventura R. Comparison of intravenous coronary angiography using synchrotron radiation with selective coronary angiography. J Synchrotron Radiat 2003;10:219-27. 10.1107/S0909049503001973 [DOI] [PubMed] [Google Scholar]
- 36.Bertrand B, Esteve F, Elleaume H, Nemoz C, Fiedler S, Bravin A, Berruyer G, Brochard T, Renier M, Machecourt J, Thomlinson W, Le Bas JF. Comparison of synchrotron radiation angiography with conventional angiography for the diagnosis of in-stent restenosis after percutaneous transluminal coronary angioplasty. Eur Heart J 2005;26:1284-91. 10.1093/eurheartj/ehi165 [DOI] [PubMed] [Google Scholar]
- 37.Bonanno G, Coppo S, Modregger P, Pellegrin M, Stuber A, Stampanoni M, Mazzolai L, Stuber M, van Heeswijk RB. Ultra-highresolution 3D imaging of atherosclerotic in mice with synchrotron differential phase contrast: a proof of concept study. Sci Rep 2015;5:11980. 10.1038/srep11980 [DOI] [PMC free article] [PubMed] [Google Scholar]
- 38.Zhang MQ, Zhou L, Deng QF, Xie YY, Xiao TQ, Cao YZ, Zhang JW, Chen XM, Yin XZ, Xiao B. Ultra-high-resolution 3D digitalized imaging of the cerebral angioarchitecture in rats using synchrotron radiation. Sci Rep 2015;5:14982. 10.1038/srep14982 [DOI] [PMC free article] [PubMed] [Google Scholar]
- 39.Li R, Wang D, Sun C, Lagerstrom R, Tan H, He Y, Xiao T. Towards automated quantitative vasculature understanding via ultra high-resolution imagery. Adv Exp Med Biol 2015;823:177-89. 10.1007/978-3-319-10984-8_10 [DOI] [PubMed] [Google Scholar]
- 40.Sun Z, Choo GH, Ng KH. Coronary CT angiography: current status and continuing challenges. Br J Radiol 2012;85:495-510. 10.1259/bjr/15296170 [DOI] [PMC free article] [PubMed] [Google Scholar]
- 41.Sun Z, Squelch A. Patient-specific 3D printed models of aortic aneurysm and aortic dissection. J Med Imaging Health Inform 2017;7:886-9. 10.1166/jmihi.2017.2093 [DOI] [Google Scholar]
- 42.Giannopoulos AA, Steigner ML, George E, Barile M, Hunsaker AR, Rybicki FJ, Mitsouras D. Cardiothoracic applications of 3-dimensional printing. J Thorac Imaging 2016;31:253-72. 10.1097/RTI.0000000000000217 [DOI] [PMC free article] [PubMed] [Google Scholar]
- 43.Sun Z, Lee SY. A systematic review of 3D printing in cardiovascular and cerebrovascular diseases. Anatol J Cardiol 2017;17:423-35. [DOI] [PMC free article] [PubMed] [Google Scholar]


