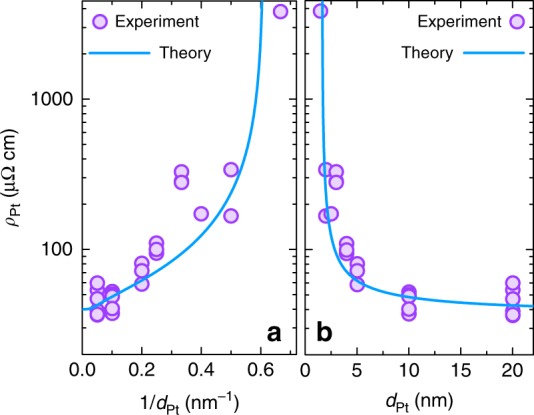
Fig. 1.

Thickness dependence of the Pt resistivity. Dependence of the Pt resistivity ρPt on a the inverse thickness 1/dPt, b the thickness dPt. Note the logarithmic scale of y-axis. Filled circles show the experimental data, line shows the resistivity calculated using Eq. (23) from the literature26 and values ρ∞ = 40 µΩ cm, λ = 10 nm, p = 0.8, ζ = 0.2526. Resistivity of the Pt films increased with the decreasing thickness due to increased contribution from the surface and grain boundaries scattering. See Supplementary Note 3 for further details
