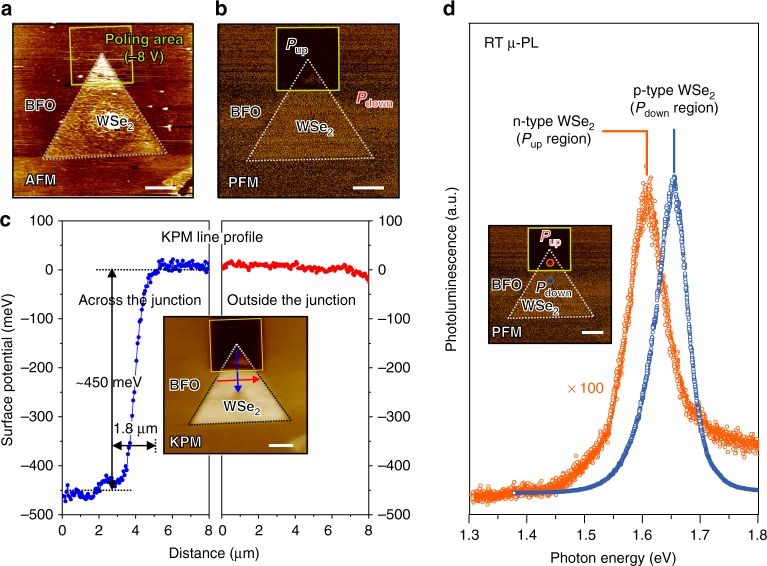
Fig. 2.
The scanning probe microscope images and μ-PL spectra of the WSe2 pn homojunction. WSe2 on Pup and Pdown regions from measurements with an AFM and PL. a, b AFM and PFM taken of a WSe2 sheet on the BFO ferroelectric layer as grown. The solid line shows poled regions with bias −8 V at an AFM tip (yellow lines). A PFM image taken of a WSe2 sheet on a BFO layer with Pup and Pdown regions, which shows the out-of-plane ferroelectric polarization in BFO to have phase difference 180°. c KPM image and line profile image taken across and outside the Pup and Pdown homojunction. d PL of a WSe2 sheet taken from the Pup and Pdown homojunction. The scale bars in the figures are 5 μm

