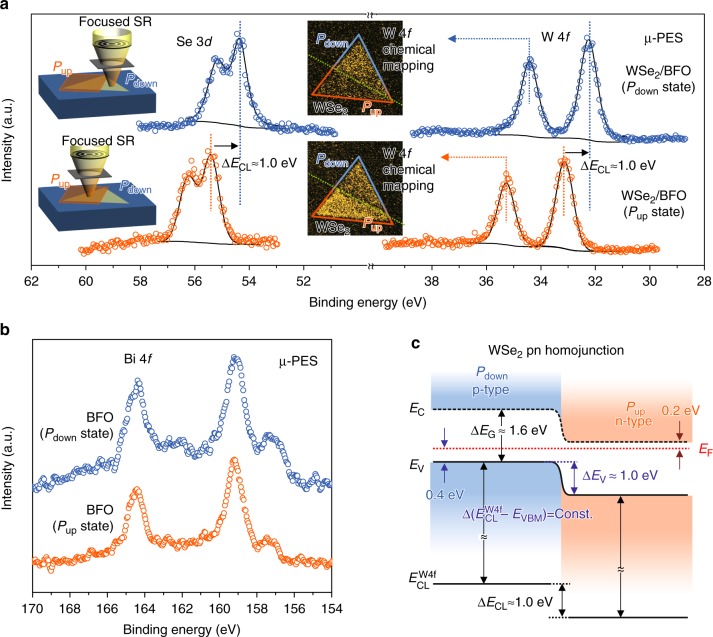
Fig. 3.
SPEM images and μ-PES measurements on the WSe2 pn homojunction. Se 3d, W 4f, and Bi 4f core-level photoelectron spectra measured with SPEM in Pup and Pdown regions of a WSe2/BFO homojunction. a Core-level spectra of Se 3d and W 4f recorded from a Pdown (blue) and a Pup (orange) region. SPEM images of W 4f taken in 34.6 eV and 35.4 eV, which correspond to a Pdown and a Pup region, respectively. b Core-level spectra of Bi 4f emitted from the BFO substrate. c The band structure deduced from a reveals the pn junction for WSe2 in Pdown and Pup regions near 300 K

