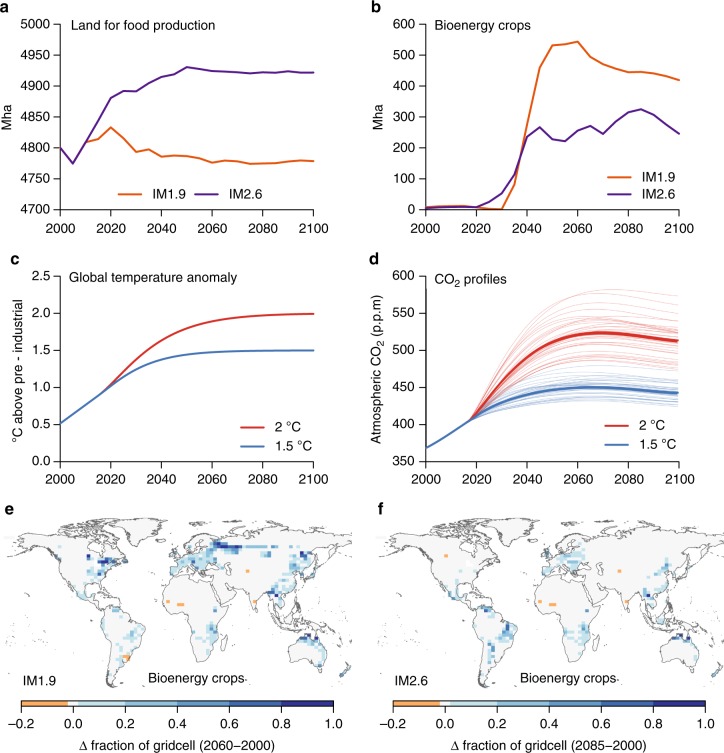
Fig. 1.
Scenarios for land-use and climate change. a, b Land used for food production (crops and pasture) and bioenergy crops from the IMAGE SSP2 scenarios IM1.9 and IM2.6 (available from https://data.knmi.nl/datasets?q=PBL). c Temperature profiles for the idealized scenarios reaching nearly 1.5 °C and 2 °C by 2100. d CO2 concentrations for each of the 34 ESMs emulated with IMOGEN. The CO2 concentrations relate to the temperatures in c depending on each model’s climate sensitivity (Methods). e, f Spatial maps of change in land for bioenergy crops in IM1.9 and IM2.6. For each scenario, the change is shown as the difference between 2000 and the year of maximum extent of bioenergy crops (2060 for IM1.9 and 2085 for IM2.6)

