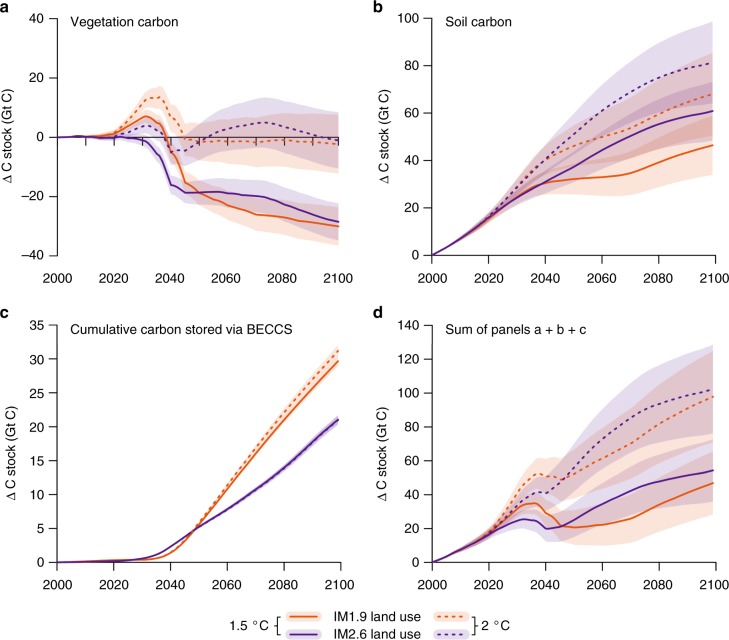
Fig. 2.
Carbon cycle responses to two land-use and two climate stabilization scenarios simulated by the land surface model JULES. Land-use scenarios are shown with different colours: IM1.9 (orange) and IM2.6 (purple), and the climate scenarios are shown with different line patterns: 1.5 °C (solid) and 2 °C (dashed) above preindustrial by 2100. Panels show simulated vegetation (a) and soil carbon (b), the cumulative storage of carbon through BECCS (c), and the total land carbon stock (including captured carbon via BECCS) (d). Shading shows ± 1 standard deviation from the ensemble mean from the 34 ESM climates represented in IMOGEN

