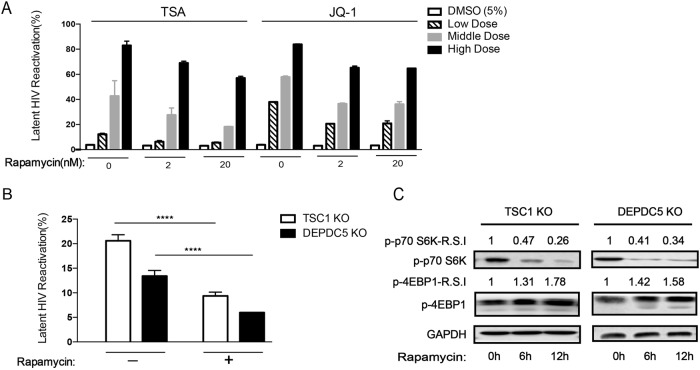
Fig. 3. The mTOR pathway is associated with HIV latency.
a C11 cell pretreatment with rapamycin (2/20 nM) for 6 h to reactivate HIV in the presence of increasing concentrations of TSA/JQ1. Reactivation of HIV was assessed by measuring GFP by flow cytometry. Data represent the mean ± SD. b The percentage of GFP+ cells upon rapamycin (2 nM) treatment in TSC1/DEPDC5 knockout C11 cells. Data represent the mean ± SD of triplicate values, representative of two independent experiments. The significance of differences between groups was determined using the two-tailed Student’s t-test (****P < 0.001). c Rapamycin stimulates phosphorylation of S6 and 4EBP1 in TSC1/DEPDC5 knockout C11 cells. Cells were untreated or pre-treated with rapamycin (2 nM) for 6 h/12 h. Images shown are representative of three independent experiments

