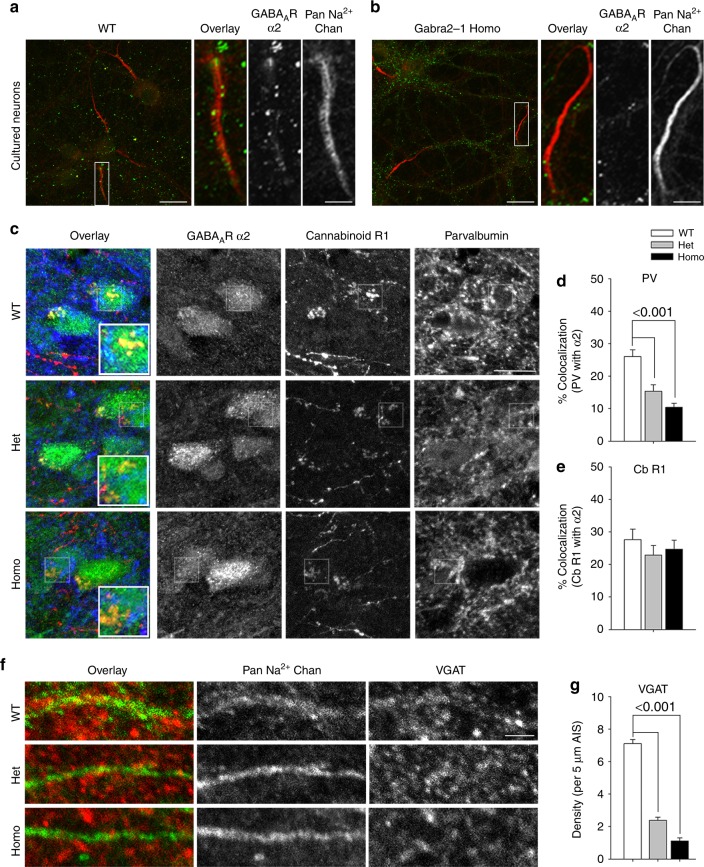
Fig. 6.
Examination of the subcellular localization of GABAAR α2-subunit clusters in Gabra2-1 mice. Cultured cortical neurons from wildtype (a) and Gabra2-1 homozygous (b) pups stained with antibodies directed against GABAAR α2 (green) and sodium channels (red), showing zooms of representative AIS segments. c Colocalization of GABAAR α2 (green) with CB1R (red) and parvalbumin (blue) clusters in the CA1 of wildtype, heterozygous and homozygous Gabra2–1 mice. Quantification of the colocalization of GABAAR α2 with parvalbumin (d WT—26.05 ± 2.12; Het—15.34 ± 2.06; Homo—10.41 ± 1.24) and CB1R (e WT—27.64 ± 3.30; Het—22.90 ± 2.99; Homo—24.73 ± 2.74). f Staining for VGAT (red) positive clusters to mark inhibitory presynaptic compartments, along with a Pan-sodium channel antibody (green) to label the axon initial segment. g Quantification of the number of VGAT positive clusters per 5 µm of AIS (WT—7.11 ± 0.26; Het—2.39 ± 0.19; Homo—1.11 ± 0.18). Scale bar = 10 µm (A low mag, C), scale bar = 5 µm (A zoom, F). All plots shown and all values listed are mean ± standard error, p values from ANOVA

