Fig. 1.
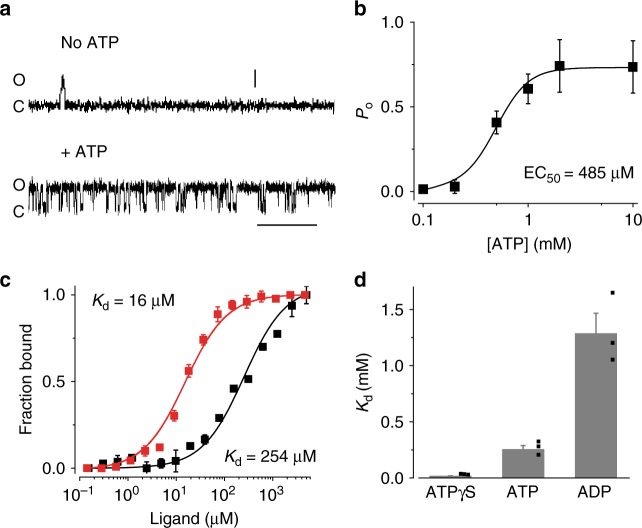
The influence of ATP on KpBest and the interaction between them. a Current traces of single KpBest channels recorded from planar lipid bilayers at 80 mV in the absence (top) and presence (bottom) of 2 mM ATP (Scale bar, 3.5 pA, 250 ms). b The open probability of the KpBest channel with different concentrations of ATP. n = 3 for each point. The plot was fitted to the Hill equation. c The MST binding curves of KpBest to ATP (black) and ATPγS (red). Protein fraction bound vs. ligand, n = 3 for each point. d Bar chart showing the binding affinities of KpBest to ATP analogs. n = 3 for each bar. All error bars in this figure represent standard error of the mean (s.e.m.)

