Fig. 7.

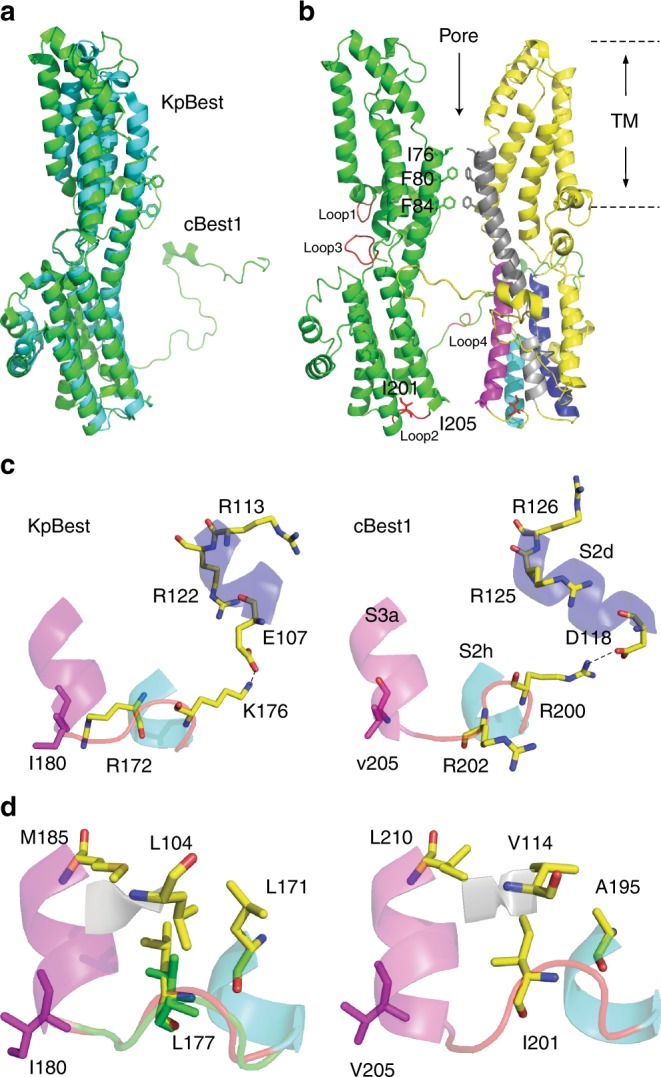
Structural analysis of bestrophin channels. a Structure alignment of KpBest (blue) and cBest1 (green) as shown by superposition of their protomers. b Ribbon diagram of two oppositely facing (144°) protomers of an hBest1 pentamer is shown with the extracellular side on the top. The side chains of I201 are in red. Loops 1–4 on the left protomer are in red. Helices surrounding the ATP-binding loop on the right protomer are labeled in the same colors as those in (c, d), Fig. 3A and Figure S5 for comparison. c Visualization of the ATP-binding loop (red), and critical residues potentially involved in ATP binding. Left, KpBest; right, cBest1. d Visualization of the ATP-binding loop (red for WT and green for the L177T mutant) and the surrounding hydrophobic residues. Left, KpBest; right, cBest1
