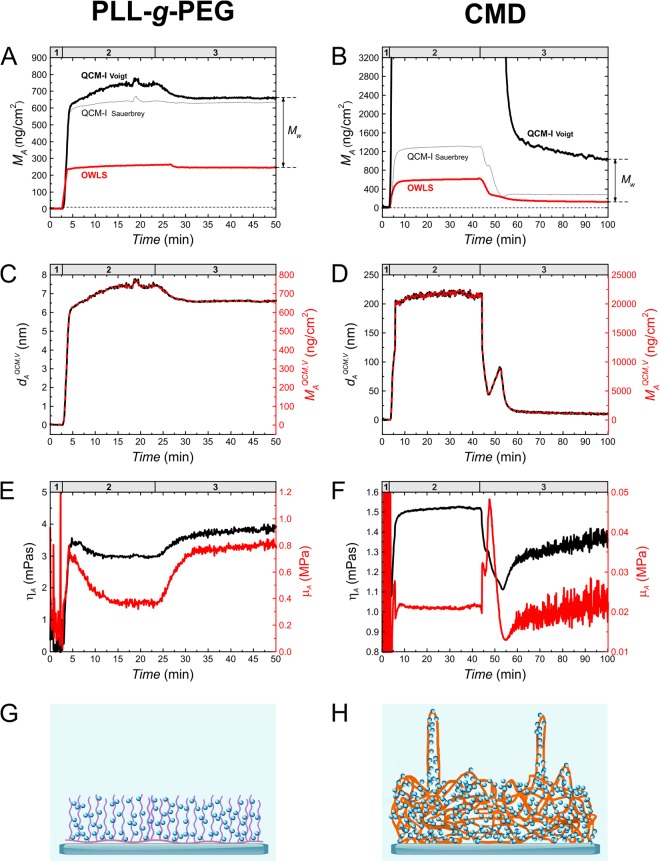
Figure 3.
Results from the Voigt-based viscoelastic model and determination of the mass of bound water. (A,B) Areal mass density sensograms of in situ QCM-I (solid black line) and OWLS (solid red line) measurements on PLL-g-PEG (A) and CMD (B) deposition experiments. The numbers in the headers indicate the corresponding experimental sections (detailed in Fig. 2). Two types of QCM-I mass interpretations are plotted. The thicker lines belong to the mass data calculated by the Voigt-based model, while the thinner lines correspond to the 3rd overtone Sauerbrey mass (S3). In case of the CMD plot (B), the data of the fitted Voigt mass were smoothed by adjacent-averaging method using a 10-point averaging window. The dashed line underneath is an extension of the baseline. At the deposition section of CMD experiment, the calculated Voigt mass was too high for a proper interpretation, therefore only the masses up to 3200 ng/cm2 are shown. (C,D) Full mass (dashed red) as well as thickness plots (solid black curves) are shown in graph C and D. The thickness and mass curves have the same shape as they are simply proportional by the factor of layer density (Eq. (5), Section 4.4). The layer density was fixed at 1000 kg/m3. (E,F) Additional model calculation results as a function of time: shear viscosity (black) and shear elastic modulus (red) of PLL-g-PEG and CMD adlayers. (G,H) The drawings are demonstrating the proposed structure of the formed polymer layers, where both the polymer chains and bound water molecules are indicated.

