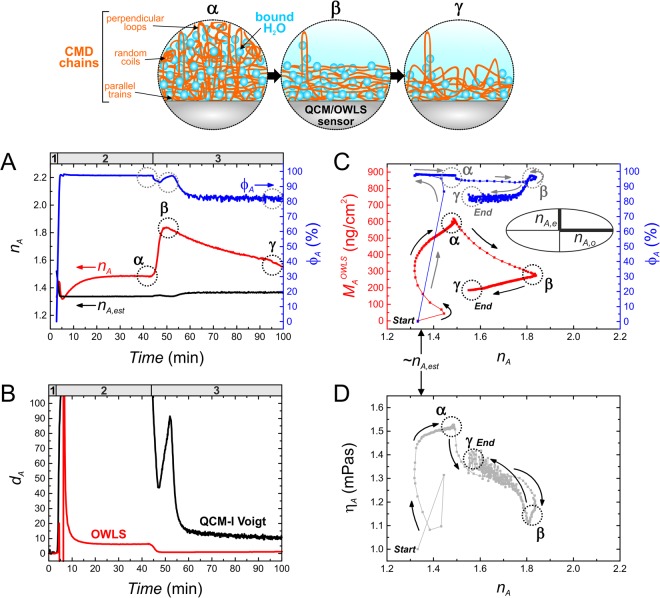
Figure 4.
Revealed conformational changes in CMD layers in terms of hydration and viscoelastic properties, based on our developed data analysis methodology and the resulted composite graphs. The illustrations on the top demonstrate the assumed conformational changes in the formed CMD layer, relating to certain experimental phases (times) which are indicated in the corresponding graphs by α, β and γ, respectively. The numbers in the headers indicate the experimental sections which are detailed in Fig. 2. Graph A and B represent the adlayer refractive index (nA) and hydration (φA) as well as mechanical and optical thickness data (dAOWLS and dAQCM,V) obtained at the whole experimental timescale. Graph B shows the thicknesses originating from both the OWLS and QCM-I measurements, using the same hydrated thickness data of graph D in Fig. 3. The values of nA and dA were calculated from OWLS measurements using the isotropic homogenous 4-layer mode equations. The estimated (realistic) refractive index of the CMD layer (nA,est) was also calculated, based on the known refractive index of bulk dextran and determined hydration degree. These nA,est values (1.33–1.36) provided a practical boundary for the isotropic-anisotropic transition (shown in graph A,C and D). Graph C was compiled from nA and φA data of graph A, providing useful physical parameters over the measured dry CMD masses (MAOWLS). In the inset of graph C, the refractive index ellipsoid demonstrates the observed negative birefringence in the adlayer (nA,o > nA,e). Graph D combines the magnitude of anisotropy (nA) with layer viscosity (ηA), where the latter quantity was independently determined from QCM-I.

