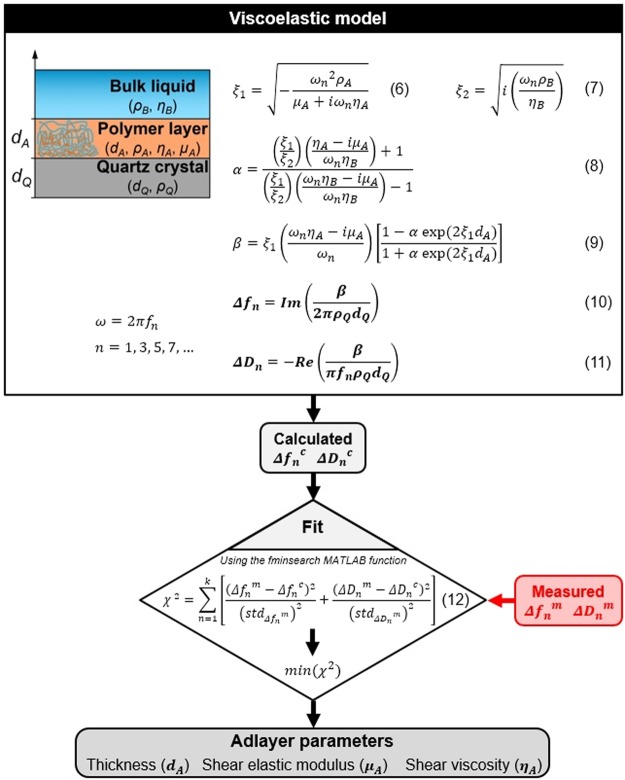
Figure 6.
Schematic representation of the QCM data analysis code implemented in MATLAB. In the inset figure on the left upper side, one can see the structure of the applied model where the QCM chip was covered by one viscoelastic film consisted of the deposited polymer chains. The used equations of the Voigt-based model can be seen in the scheme52, where ρQ and hQ are the density and thickness of the crystal respectively, ρB and ηB are the density and viscosity of the bulk liquid as well as ωn is the angular frequency of the oscillation at a given n overtone. The hydrated thickness, density, shear viscosity and shear elastic modulus of the examined adlayer are represented by dA, ρA, ηA and µA, respectively. In the calculation of the error function χ2 the Δfnm, Δfnc as well as ΔDnm, ΔDnc are the measured and computed frequency and dissipations, respectively, the std values correspond to the standard deviations of the measured frequencies and dissipation at the baseline and k denotes the highest overtone number.

