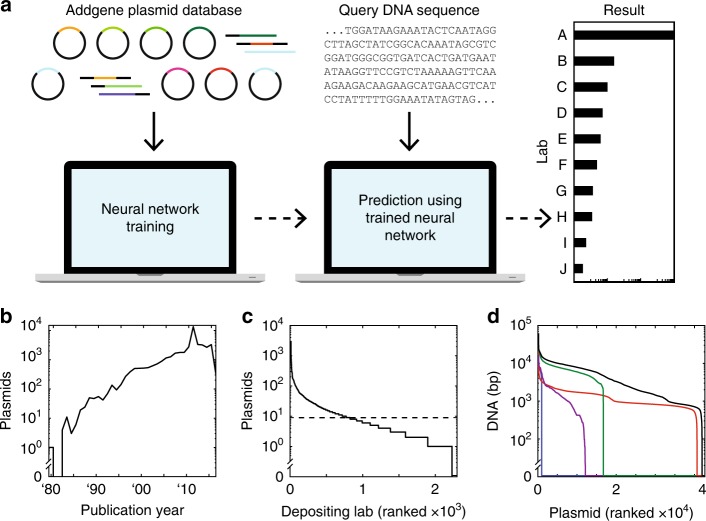
Fig. 1.
Plasmid dataset and machine learning approach. a Machine learning plasmid attribution strategy. b Plasmid publication dates across the dataset. c Depositing labs ranked by how many plasmids they have submitted in the dataset. A minimum cutoff of nine plasmids was enforced for training (dashed line). d Plasmids ranked by how much associated DNA sequence (in bp) has been submitted. DNA sequence information is categorized as Partial Depositor (purple), Full Depositor (green), Partial Repository (red), and Full Repository (blue). The summed DNA sequence length across all four categories is also shown (black). Plasmid order not maintained between the five curves

