Fig. 5.
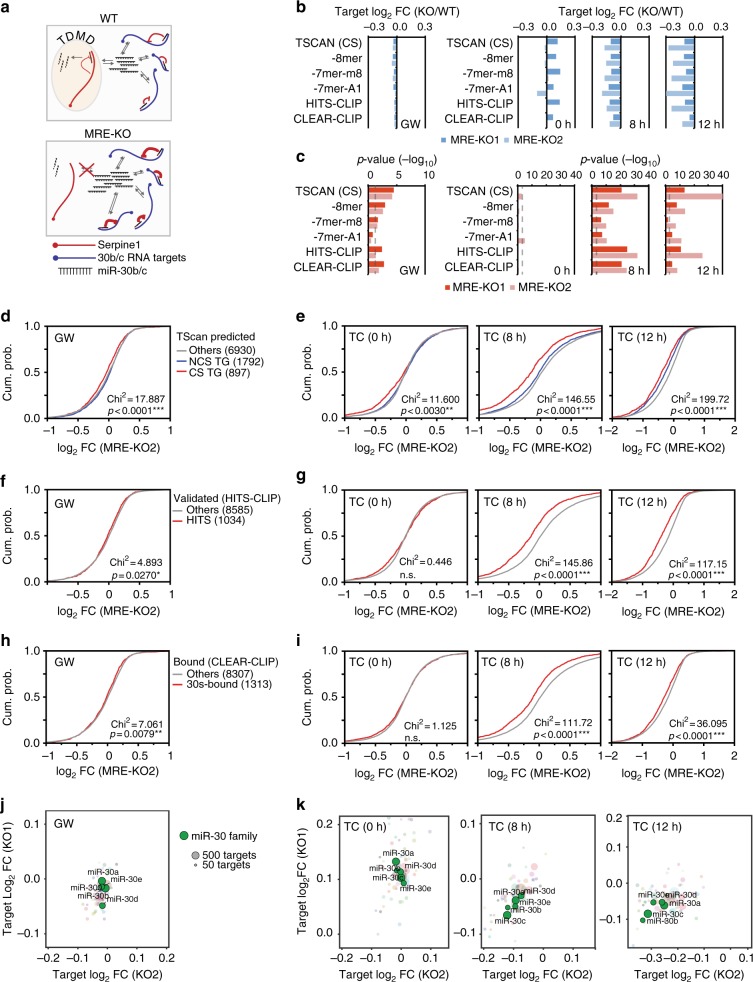
miR-30 activity increases in Serpine1-MRE-KO cells. a Scheme representing WT and MRE-KO cells expected behaviour in terms of miR-30c activity with canonical targets (in blue) and decay targets (in red). When TDMD is suppressed (i.e., by removing the MRE from a TDMD target, like Serpine1), miRNA increases in abundance and is redistributed on targets thus increasing its repression activity. b, c Expression analysis of WT and MRE-KO cells was performed by RNA-seq in different conditions of cell growth (GW: growing cells; 0 h: quiescent cells; 8 h and 12 h: serum-stimulated cells). b Bar charts report the difference between the median log2 fold changes (MRE vs WT) of different subsets of miR-30 targets. The analysis was performed with targets either predicted by TargetScan7.1 (897 conserved targets, CS, also broken down by seed-match as 8-mer, 7-mer-m8, or 7-mer-A1) or validated by HITS-CLIP (1037 targets, from Tarbase v7.035) and CLEAR-CLIP (1315 targets36). c p-values of data shown in (b). d, e Cumulative distribution functions (CDF) of log2 FC of mRNA (MRE vs WT) for conserved targets (CS), not conserved targets (NCS) and genes not predicted as targets (Other). f, g CDF plot as in (d, e) with miR-30 targets from HITS-CLIP experiments35. h, i CDF plot as in (d, e) with miR-30 targets from CLEAR-CLIP experiments36. j, k Targets for all expressed miRNAs were identified by CLEAR-CLIP. The bubble plots report the median log2 fold changes (MRE-KO vs WT), calculated for every miRNA having at least 50 expressed targets. Colour code is for miRNA families. Members of the miR-30 family are highlighted in green. All statistical analyses (chi-square and p-value) were performed using the Wilcoxon test

