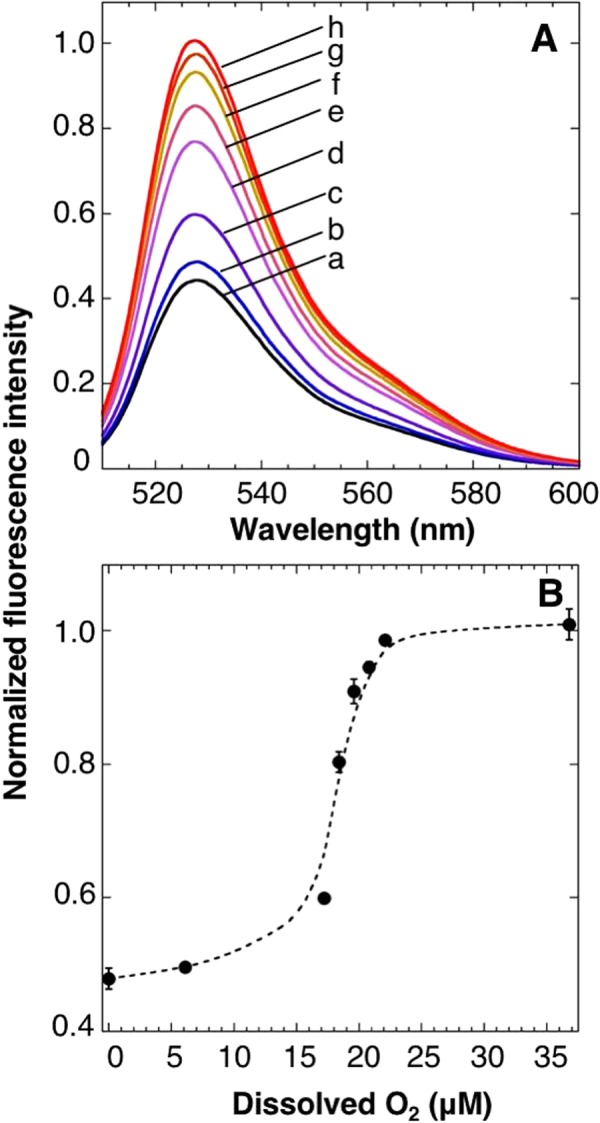
Figure 5.

Oxygen sensitivity of ANA-Y. (A) Emission spectra of ANA-Y were measured in the presence of various concentrations of oxygen. Traces a, b, c, d, e, f, g, and h are emission spectra of ANA-Y in the presence of dissolved oxygen at 0, 6.1, 17.2, 18.4, 19.6, 20.8, 22.1, and 36.8 μM. (B) Changes in oxygen-dependent fluorescence of ANA-Y were determined from fluorescence emissions at 527 nm. Fluorescence emission intensities of ANA-Y were measured as in (A). Data are presented as means ± s.d. from three replicates.
