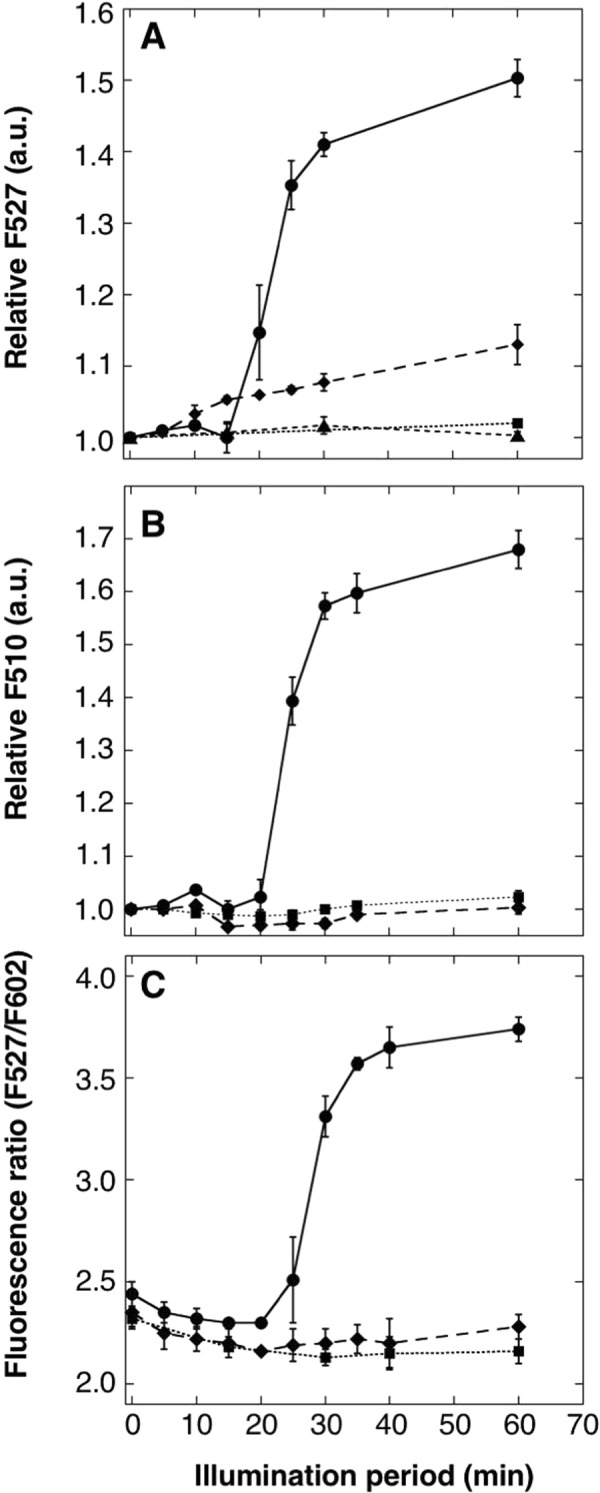
Figure 8.

Monitoring of photosynthetic oxygen production in cyanobacteria using ANA sensors. Time courses of changes in emission intensities of (A) ANA-Y, (B) ANA-G and (C) ANA-Q solution suspending A.7120 cells; suspensions of A.7120 cells (1.2–2.4 μg Chl mL−1) in the presence (diamond) or absence (circle) of 10-μM DCMU (ANA-Y) or 12.5-μM DCMU (ANA-G or ANA-Q) were illuminated at 13 μmol photons m−2 s−l and emission intensities of ANA-Y (1.7 μM) at 527 nm, ANA-G (1.7 μM) at 510 nm and ANA-Q (1.0 μM) at 527 nm and 602 nm were measured. Solution without A.7120 cells were used as a negative control (square). Time courses of emission intensity changes of Venus in A.7120 cells suspension was measured as a control (A, triangle). Fluorescence intensity data are presented relative to that of ANA-Y or ANA-G at time 0 (1.0), or fluorescence ratio of F527/F602. All data represent means ± s.d. from three replicates.
