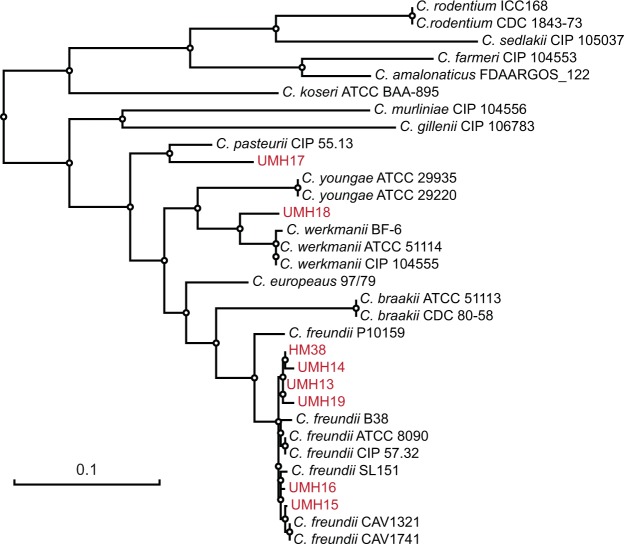
Figure 1.
Phylogenetic distribution of strains collected in this study. The maximum-likelihood tree was generated from nucleotide sequences of concatenated fusA, leuS, rpoB, and pyrG alleles. Information from type strains was included where available and the strains collected in this study (UMH13–19 and HM38) are indicated by red font. The tree was manually rooted on the node between C. koserii and the eight species belonging to the C. freundii complex. The scale bar represents nucleotide substitutions per site.

