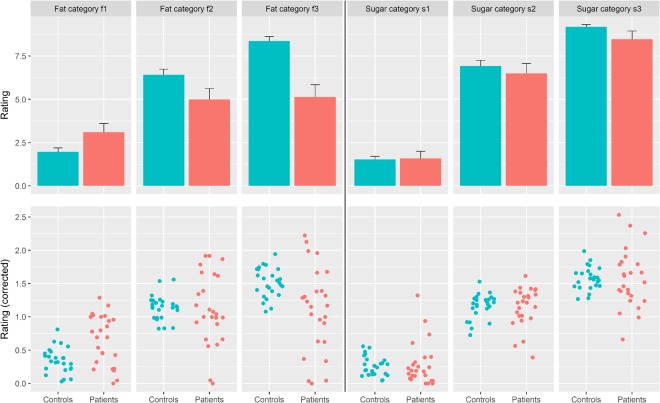
Figure 1.
Sugar and fat ratings. Shown are patients’ and controls’ sugar and fat ratings for the three chocolate milkshakes containing increasing amounts of either sugar (s1 to s3) or fat (f1 to f3). (a) The bar plots represent the mean, the whiskers the standard error of the absolute ratings of patients (red) and controls (green) (b) The scatter plots show the mean-corrected ratings of each participant. Patients are colored in red, controls in green. We found no significant differences in sugar ratings between patients and controls. For fat ratings, we found significant differences for f1 and f3, but not for f2.

