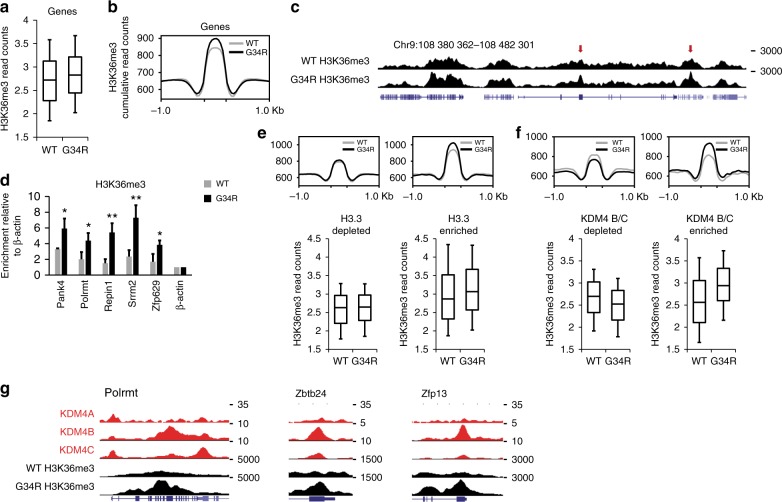
Fig. 2.
H3.3 G34R triggers gains of H3K36me3 within genes in a Kdm4-associated manner. a Normalised H3K36me3 ChIP-seq reads across all H3K36me3-enriched genes in WT and G34R cells. b Cumulative ChIP-seq read counts of H3K36me3 in WT and G34R cells. c Screenshot of H3K36me3 ChIP-seq in WT and G34R mutated cells. Red arrows indicate gains of H3K36me3 at discrete genomic sites. d H3K36me3 ChIP-qPCR in WT and G34R cells. Results are normalised for input and bars represent mean enrichment of three independent experiments, calculated relative to a negative control (β-actin promoter). Error bars represent standard deviation of three independent experiments (n = 3). P-values calculated using Student’s T-test (*P < 0.05, **P < 0.01). e Cumulative and normalised H3K36me3 read counts at H3.3 depleted (n = 7795) and enriched (n = 3161) genomic regions. f Cumulative and normalised H3K36me3 read counts at KDM4 B/C depleted (n = 4950) and enriched (n = 618) genomic regions. g Screenshots of WT-KDM4 A/B/C and H3K36me3 in WT and G34R cells at three representative genes: Polrmt, Zbtb24 and Zfp13. ChIP-seq of KDM4-A36, -B and -C37 were obtained from GEO (accession number GSE64252 and GSE43231, respectively). Boxes represent 25th, median and 75th percentile; whiskers represent 10th and 90th percentiles

