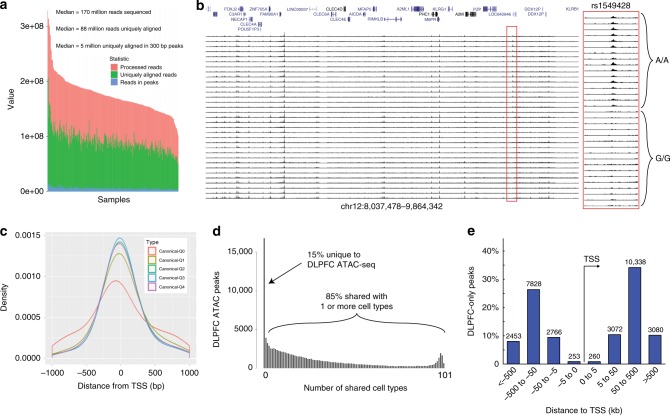
Fig. 1.
ATAC-seq on frozen DLPFC samples. a Sequencing statistics from all libraries (N = 288) show largely similar total number of reads (pink), uniquely aligning reads (green), and reads that map to ATAC-seq peaks (blue). b Individual brain ATAC-seq data in a representative genomic region showing largely congruent identification of regions of open chromatin. Some samples have lower signal to noise (correlated with covariates like postmortem interval and RNA integrity number). Region in red is a chromatin QTL, note lower signal for individuals with GG genotype vs. AA genotype. c Open chromatin in relation to transcription start sites (TSS). The TSS is at zero, right is inward in the direction of transcription, and left is outward from the gene. Density curves for all known GENCODE v25 transcripts (one principal transcript per protein-coding gene). Colored curves show different expression levels in DLPFC: Q0 = no expression, Q1–Q4 = lowest to highest expression quartiles. d Number of DLPFC ATAC-seq peaks that overlap with putative regulatory elements identified from 101 different cell types analyzed by the Epigenome Roadmap Project (brain tissues excluded). Approximately 16% (n = ~17,000) ATAC-seq peaks are unique to DLPFC. e Location of DLPFC-only ATAC-seq peaks relative to the TSS indicates that the majority are in non-promoter regions

