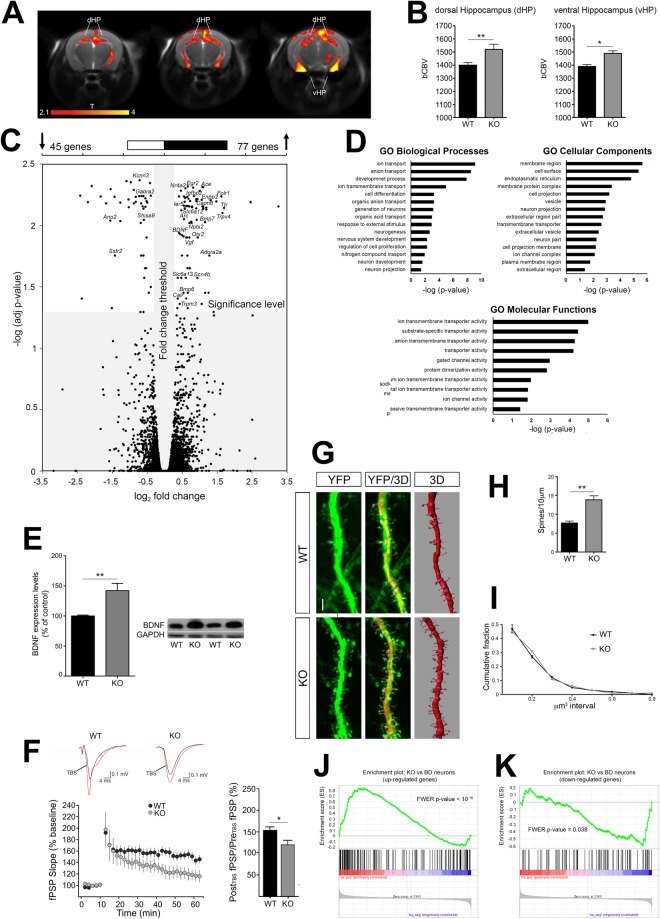
Figure 3.
5-HT depleted mice display increased hippocampal functional activity and neuroplasticity, as well as common transcriptional abnormalities with neurons derived from BD patients. (A)Anatomical distribution and (B) quantification of brain areas exhibiting a significant increase in bCBV in KO mice with respect to control WT littermates (n = 10, one-way ANOVA: dHPC, F1,18 = 6.632, p = 0.0191; vHPC, F1,18 = 5.620, p = 0.0291; T > 2.1, corrected cluster significance p = 0.01). Foci of increased bCBV (red/orange) are superimposed onto contiguous 0.75 mm MRI coronal images. The effect has been quantifies in hippocampal areas on slice-to-slice basis. (C) Scatterplot of padj-values versus fold-change between WT and KO mice for all genes. Grey area indicates cut-offs for significance. Upper bar: number of DE genes significantly up-regulated (right) and significantly downregulated (left) in KO mice as compared to controls. (D) Representative Gene Ontology categories identified from the DE genes. (E) Quantification and representative images of BDNF protein levels (n = 8, one-way ANOVA, F1,14 = 12.078, p = 0.0037) measured by Western Blotting in WT and KO mice. Images are cropped from different blots. Full length blots are displayed in Supplementary Fig. S3. Data are expressed as percentage of control ± s.e.m. **p < 0.01. (F) Theta burst stimulation (TBS) induces LTP at CA3-CA1 synapses of WT mice (n = 8, RM1W, F7,30 = 22, p < 0.0001; Tukey’s p < 0.05). In 5-HT depleted KO mice, LTP was significantly impaired (n = 9, RM1W, F8,30 = 7, p = 0.0111, Tukey’s p > 0.05), and reduced compared to controls (WT vs KO Student’s t test p = 0.0232). (G) Representative images of YFP-labeled CA3 apical dendrites and their 3D reconstruction. (H) Quantification of spine density (WT n = 7; KO n = 8, for spine density one-way ANOVA, F1,13 = 18.569, p = 0.0008) and (I) volume distribution in CA3 dendrites. (J,K) GSEA-calculated enrichment between the transcriptional profile of KO mice and that of neurons derived from patients with BD for (J) upregulated and (K) downregulated genes. Data are expressed as mean ± s.e.m. **p < 0.01. bCBV, basal Cerebral Blood Volume; dHPC, dorsal hippocampus; vHPC, ventral hippocampus. n indicates biological replicates. Scale bar = 2 μm.

