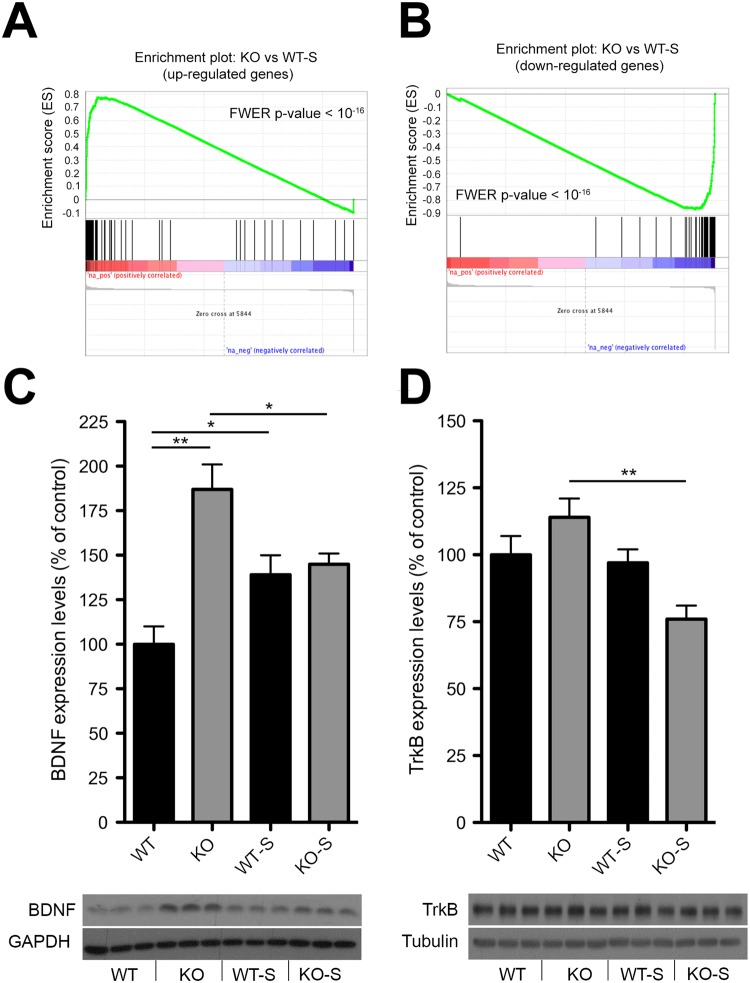
Figure 5.
Impaired hippocampal adaptive mechanism to stress in KO mice. (A,B) GSEA-calculated enrichment score between the transcriptional profile of WT-S and KO mice. (C,D) Quantification and representative images of (C) BDNF (WT n = 9, KO n = 8, WT-S n = 10, KO-S n = 9, two-way ANOVA followed by Fisher’s post-hoc tests, genotype x uCMS interaction F3,31 = 12.066, p = 0.0015; WT vs KO F1,15 = 23.33, p = 0.0002; WT vs WT-S F1,17 = 6.744, p = 0.0188; KO vs KO-S F1,15 = 5.486, p = 0.0345) and (D) TrkB (WT n = 9, KO n = 8, WT-S n = 10, KO-S n = 9, two-way ANOVA followed by Fisher’s post-hoc tests, genotype x uCMS interaction F3,31 = 5.607, p = 0.0015; KO vs KO-S F1,14 = 15.859, p = 0.0014) protein levels measured by Western Blotting in WT-S and KO-S mice and their respective controls. Images are cropped from different blots. Full length blots are displayed in Supplementary Fig. S7. Data are expressed as mean ± s.e.m. for behavioural data, as percentage of control ± s.e.m. for biochemical data. *p < 0.05, **p < 0.01, ***p < 0.001. n indicates biological replicates.

