Fig. 4.
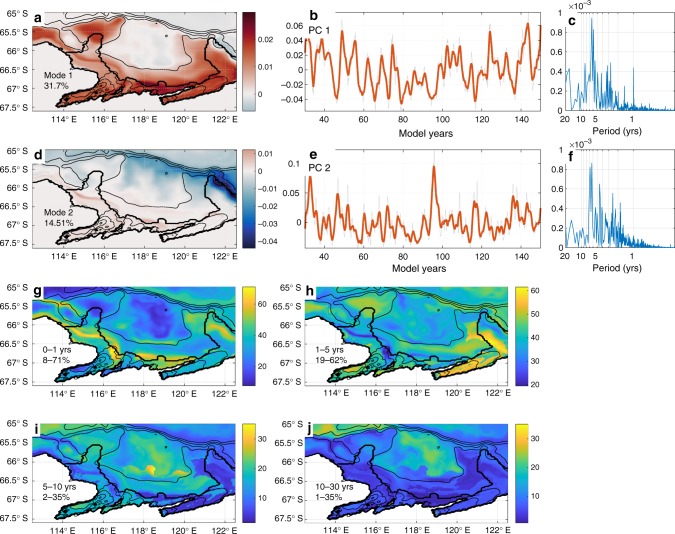
Intrinsic variability in bottom temperature. a Bottom temperature anomaly EOF mode 1 and b PC 1. c Spectral variance (power spectrum times frequency) for bottom temperature PC 1. d EOF mode 2 and e PC 2. f Spectral variance for bottom temperature PC 2. SSA in-band variance is shown for time bands g 0–1 years, h 1–5 years, i 5–10 years and j 10–30 years, with min–max explained variance shown. Thin contours show bathymetry of 500, 1500, 2000, 2500 m. Orange line in b and e is smoothed with a 1.5-yr filter, while grey line is raw data. Colour bars in g–j are scaled to the min/max variance range, as given as percentages in the lower left hand corner of each panel

