Figure 1.

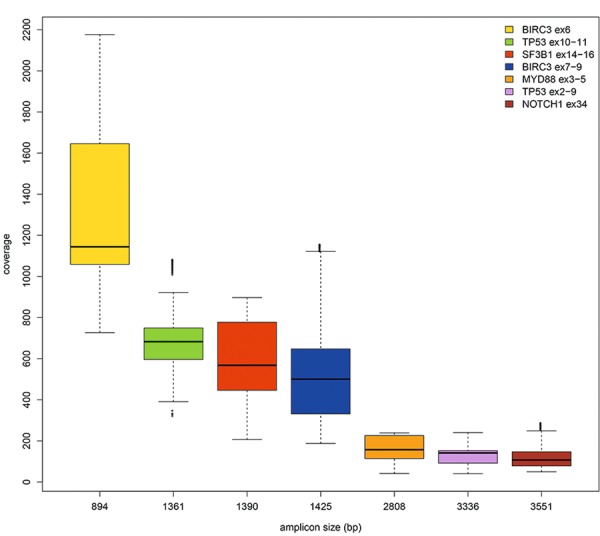
Boxplot of sequencing depth data and amplicons size (bp). The range of read depth was more uniform for longer amplicons and inversely related to the amplicon size, the smaller amplicons showing a higher sequencing depth.

Boxplot of sequencing depth data and amplicons size (bp). The range of read depth was more uniform for longer amplicons and inversely related to the amplicon size, the smaller amplicons showing a higher sequencing depth.