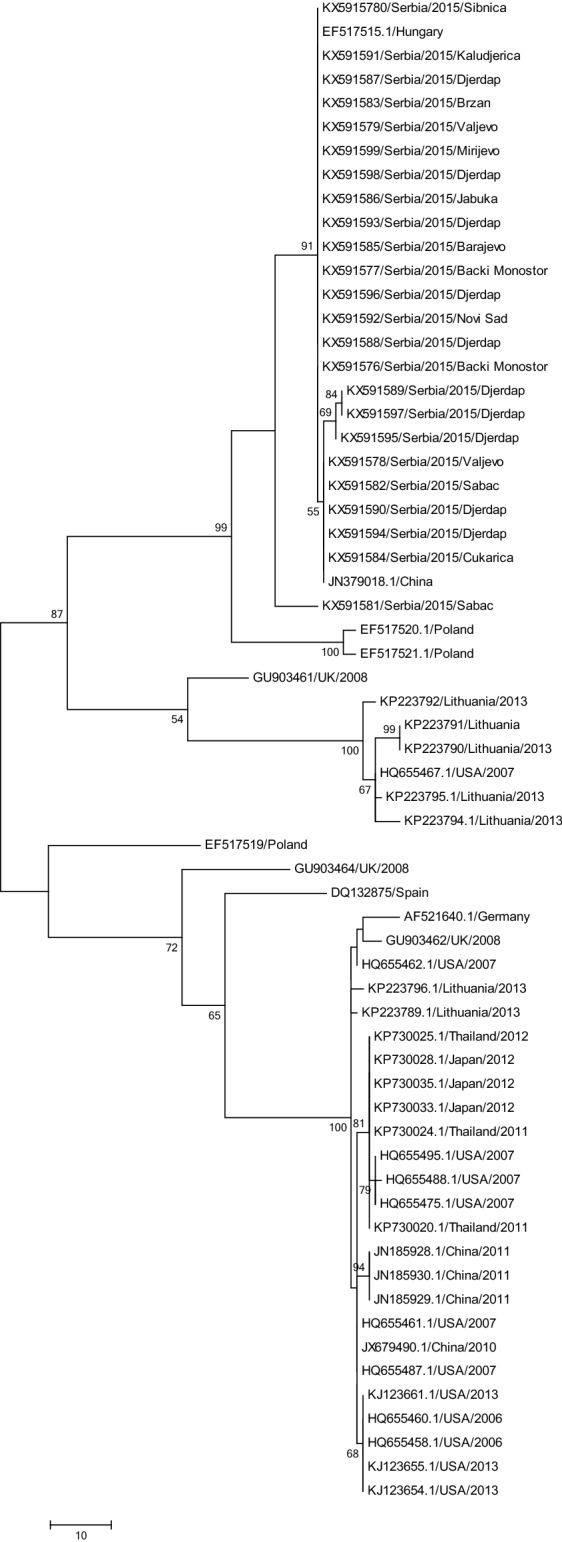
Fig. 1.

Phylogram illustrating the genetic relationships among BQCV isolates, based on the partial RNA polyprotein coding region. Evolutionary analyses were conducted in MEGA6 using maximum-parsimony. The analysis involved 63 nucleotide sequences. The percentage of replicate trees in which the associated taxa clustered together in the bootstrap test (1000 replicates) are shown next to the branches; only values > 50% were indicated. Scale bars indicate the numbers of steps for parsimony analysis
