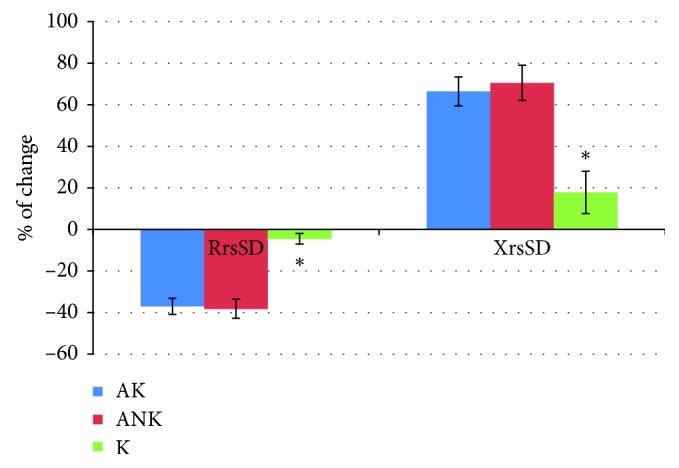
Figure 2.

Percentage of changes in the Rrs and Xrs after salbutamol in comparison to baseline in the studied groups. XrsSD: average reactance with standard deviation; RrsSD: average resistance with standard deviation; ∗significant differences (ANOVA test) for p < 0.05; AK: patients with controlled asthma; ANK: patients with uncontrolled asthma; K: control group.
