Figure 1.

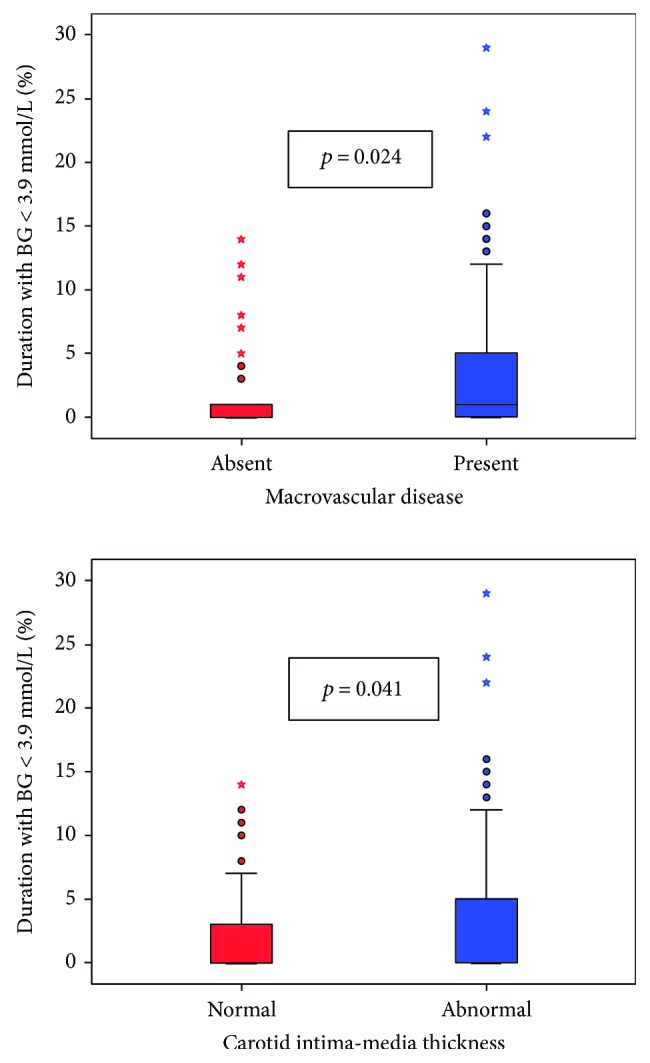
Box-and-whisker plot demonstrating relation of duration of glucose < 3.9 mmol/L (expressed as percentage of the entire 72 hr period) and macrovascular disease and carotid intima-media thickness. ∗denoting outliers.

Box-and-whisker plot demonstrating relation of duration of glucose < 3.9 mmol/L (expressed as percentage of the entire 72 hr period) and macrovascular disease and carotid intima-media thickness. ∗denoting outliers.