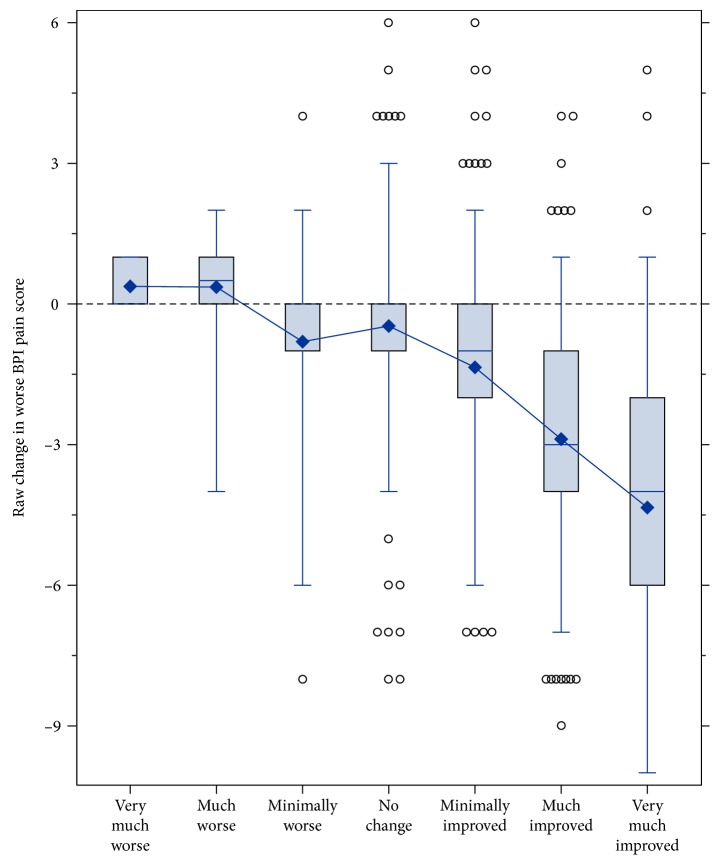
Figure 1.
Box plot of raw change in the m-BPI score from the baseline to week 5/end of study by PGIC categories. The center line inside the box represents the median, the box's hinges are the 25th and 75th percentile, the whiskers bound the central 95 percent of the distribution, the circles beyond the whiskers are outliers, and the diamond represents the mean. BPI, Brief Pain Inventory; m-BPI, modified Brief Pain Inventory; PGIC, patient global impression of change.

