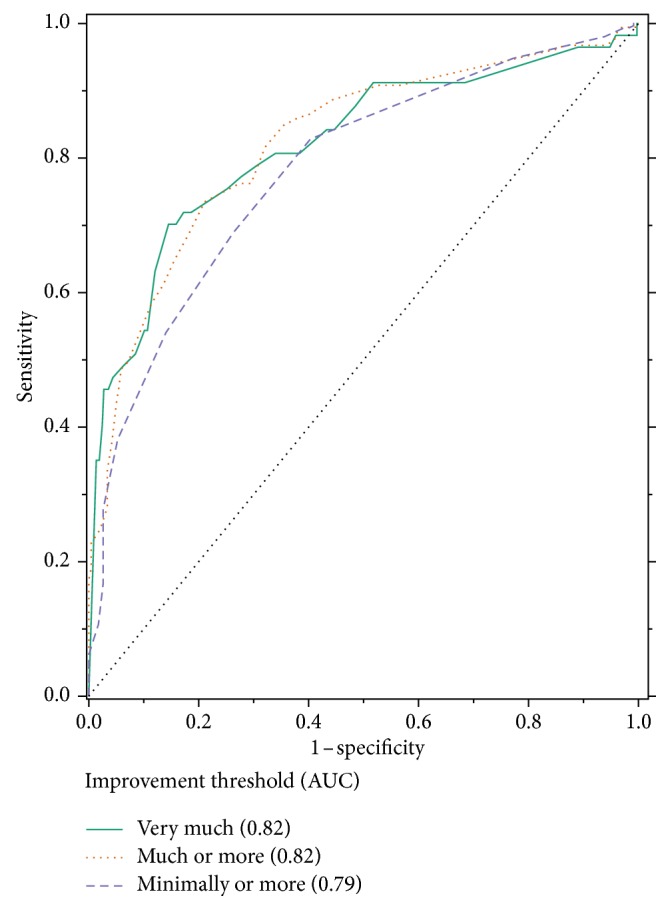
Figure 3.

ROC curve of percentage change in the m-BPI-WPS score from the baseline to week 5/end of the study and PGIC. AUC, area under the curve; m-BPI-WPS, modified Brief Pain Inventory-worst pain severity; PGIC, patient global impression of change; ROC, receiver operating characteristic.
