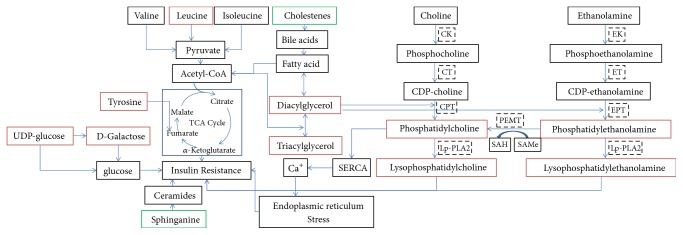
Figure 5.
The relationship between insulin resistance and 17 potential biomarkers. Red represented the biomarkers whose peak intensity rose in case group, and green represented the biomarkers whose peak intensity reduced in case group (CK, choline kinase; CT, CTP phosphocholine cytidylyltransferase; CPT, CDP-choline:1,2-diacylglycerol cholinephos-photransferase; lp-PLA2: phospholipase A2; EK, Ethanolamine kinase; ET, phosphoethanolamine cytidylyltransferase; EPT, CDP-ethanolamine:1,2-diacylglycerol ethanolaminephosphotransferase; PEMT, phosphatidylethanolamine N-methyltransferase; SAH, S-adenosylhomocysteine; SAMe, S-adenosylmethionine).

