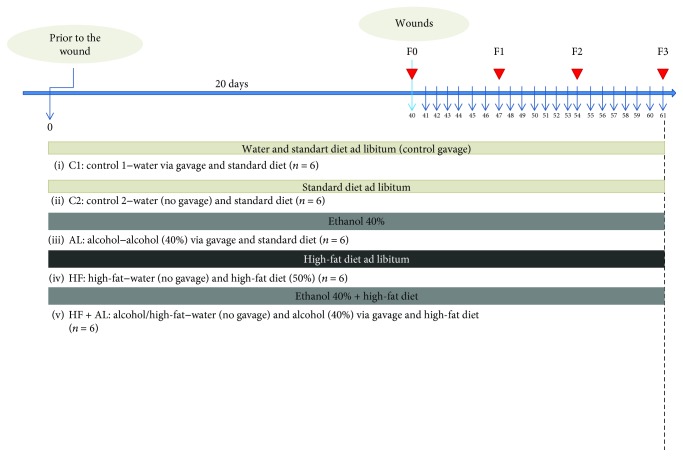
Figure 1.
Flowchart of the experimental design with the distribution of the animals in the groups, treatment time (chronological line, blue), and wound performance and fragment collection (arrowhead in red). Thirty Wistar rats were randomized into five experimental groups: C1 = control 1—water via gavage and standard chow diet; C2 = control 2—water (no gavage) and standard chow diet; AL = alcohol—water (no gavage), alcohol (40%) via gavage and standard chow diet; HF = high-fat—water (no gavage) and high-fat diet (50%); HF + AL = alcohol/high-fat—water (no gavage), alcohol (40%) via gavage and high-fat diet. F0 = intact tissue; F1, F2, and F3 = scar tissue after 7, 14, and 21 days, respectively.

